
Advertisement
Howard Marks put it nicely when he said that, rather than worrying about share price volatility, 'The possibility of permanent loss is the risk I worry about... and every practical investor I know worries about.' So it seems the smart money knows that debt - which is usually involved in bankruptcies - is a very important factor, when you assess how risky a company is. Importantly, Nava Limited (NSE:NAVA) does carry debt. But is this debt a concern to shareholders?
When Is Debt A Problem?
Debt and other liabilities become risky for a business when it cannot easily fulfill those obligations, either with free cash flow or by raising capital at an attractive price. Part and parcel of capitalism is the process of 'creative destruction' where failed businesses are mercilessly liquidated by their bankers. However, a more frequent (but still costly) occurrence is where a company must issue shares at bargain-basement prices, permanently diluting shareholders, just to shore up its balance sheet. By replacing dilution, though, debt can be an extremely good tool for businesses that need capital to invest in growth at high rates of return. The first thing to do when considering how much debt a business uses is to look at its cash and debt together.
View our latest analysis for Nava
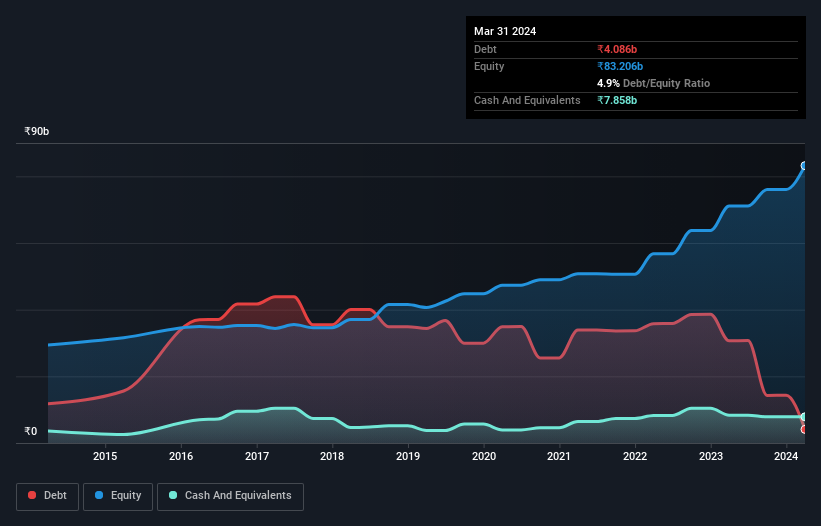
How Much Debt Does Nava Carry?
As you can see below, Nava had ₹4.09b of debt at March 2024, down from ₹30.7b a year prior. But on the other hand it also has ₹7.86b in cash, leading to a ₹3.77b net cash position.
How Healthy Is Nava's Balance Sheet?
We can see from the most recent balance sheet that Nava had liabilities of ₹6.82b falling due within a year, and liabilities of ₹6.95b due beyond that. Offsetting this, it had ₹7.86b in cash and ₹17.7b in receivables that were due within 12 months. So it can boast ₹11.8b more liquid assets than total liabilities.
This surplus suggests that Nava has a conservative balance sheet, and could probably eliminate its debt without much difficulty. Simply put, the fact that Nava has more cash than debt is arguably a good indication that it can manage its debt safely.
If Nava can keep growing EBIT at last year's rate of 14% over the last year, then it will find its debt load easier to manage. The balance sheet is clearly the area to focus on when you are analysing debt. But you can't view debt in total isolation; since Nava will need earnings to service that debt. So if you're keen to discover more about its earnings, it might be worth checking out this graph of its long term earnings trend.
Finally, a business needs free cash flow to pay off debt; accounting profits just don't cut it. Nava may have net cash on the balance sheet, but it is still interesting to look at how well the business converts its earnings before interest and tax (EBIT) to free cash flow, because that will influence both its need for, and its capacity to manage debt. Happily for any shareholders, Nava actually produced more free cash flow than EBIT over the last three years. That sort of strong cash generation warms our hearts like a puppy in a bumblebee suit.
Summing Up
While we empathize with investors who find debt concerning, you should keep in mind that Nava has net cash of ₹3.77b, as well as more liquid assets than liabilities. The cherry on top was that in converted 126% of that EBIT to free cash flow, bringing in ₹30b. So we don't think Nava's use of debt is risky. When analysing debt levels, the balance sheet is the obvious place to start. But ultimately, every company can contain risks that exist outside of the balance sheet. Case in point: We've spotted 1 warning sign for Nava you should be aware of.
At the end of the day, it's often better to focus on companies that are free from net debt. You can access our special list of such companies (all with a track record of profit growth). It's free.
Valuation is complex, but we're here to simplify it.
Discover if Nava might be undervalued or overvalued with our detailed analysis, featuring fair value estimates, potential risks, dividends, insider trades, and its financial condition.
Access Free AnalysisHave feedback on this article? Concerned about the content? Get in touch with us directly. Alternatively, email editorial-team (at) simplywallst.com.
This article by Simply Wall St is general in nature. We provide commentary based on historical data and analyst forecasts only using an unbiased methodology and our articles are not intended to be financial advice. It does not constitute a recommendation to buy or sell any stock, and does not take account of your objectives, or your financial situation. We aim to bring you long-term focused analysis driven by fundamental data. Note that our analysis may not factor in the latest price-sensitive company announcements or qualitative material. Simply Wall St has no position in any stocks mentioned.
Have feedback on this article? Concerned about the content? Get in touch with us directly. Alternatively, email editorial-team@simplywallst.com
About NSEI:NAVA
Nava
Engages in ferroalloy manufacturing, energy, mining, agribusiness, and operation and maintenance services in India, Zambia, the United States, Hong Kong, Japan, the United Arab Emirates, and internationally.
Flawless balance sheet established dividend payer.
Market Insights

Advertisement
Community Narratives
The company that turned a verb into a global necessity and basically runs the modern internet, digital ads, smartphones, maps, and AI.
Fair Value US$300.00|10.8% undervalued
OS
Community Contributor
Flowers Foods Pays A Fair Price For Health
Fair Value US$16.12|22.0% undervalued
NV
Community Contributor
TMX Group will thrive with 33.3% profit margin and enduring market moat
Fair Value CA$49.90|3.8% overvalued
LI
Community Contributor