
Advertisement
- India
- /
- Trade Distributors
- /
- NSEI:MSTCLTD
MSTC Limited's (NSE:MSTCLTD) Stock Has Been Sliding But Fundamentals Look Strong: Is The Market Wrong?
It is hard to get excited after looking at MSTC's (NSE:MSTCLTD) recent performance, when its stock has declined 15% over the past month. But if you pay close attention, you might gather that its strong financials could mean that the stock could potentially see an increase in value in the long-term, given how markets usually reward companies with good financial health. In this article, we decided to focus on MSTC's ROE.
Return on equity or ROE is a key measure used to assess how efficiently a company's management is utilizing the company's capital. In other words, it is a profitability ratio which measures the rate of return on the capital provided by the company's shareholders.
See our latest analysis for MSTC
How Do You Calculate Return On Equity?
ROE can be calculated by using the formula:
Return on Equity = Net Profit (from continuing operations) ÷ Shareholders' Equity
So, based on the above formula, the ROE for MSTC is:
31% = ₹1.8b ÷ ₹5.7b (Based on the trailing twelve months to December 2021).
The 'return' is the yearly profit. So, this means that for every ₹1 of its shareholder's investments, the company generates a profit of ₹0.31.
What Is The Relationship Between ROE And Earnings Growth?
Thus far, we have learned that ROE measures how efficiently a company is generating its profits. Depending on how much of these profits the company reinvests or "retains", and how effectively it does so, we are then able to assess a company’s earnings growth potential. Assuming everything else remains unchanged, the higher the ROE and profit retention, the higher the growth rate of a company compared to companies that don't necessarily bear these characteristics.
MSTC's Earnings Growth And 31% ROE
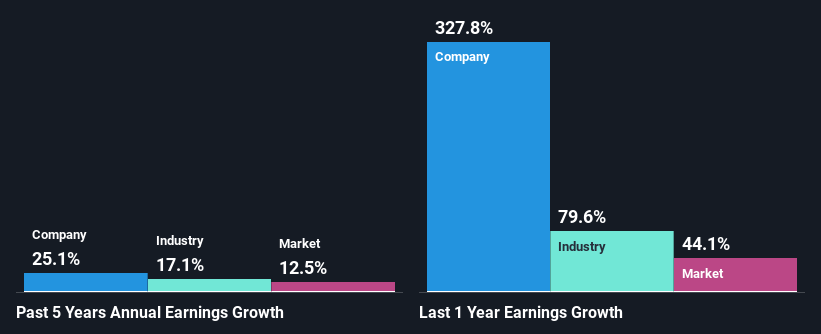
To begin with, MSTC has a pretty high ROE which is interesting. Secondly, even when compared to the industry average of 9.1% the company's ROE is quite impressive. As a result, MSTC's exceptional 25% net income growth seen over the past five years, doesn't come as a surprise.
We then compared MSTC's net income growth with the industry and we're pleased to see that the company's growth figure is higher when compared with the industry which has a growth rate of 17% in the same period.
The basis for attaching value to a company is, to a great extent, tied to its earnings growth. The investor should try to establish if the expected growth or decline in earnings, whichever the case may be, is priced in. This then helps them determine if the stock is placed for a bright or bleak future. If you're wondering about MSTC's's valuation, check out this gauge of its price-to-earnings ratio, as compared to its industry.
Is MSTC Efficiently Re-investing Its Profits?
The three-year median payout ratio for MSTC is 26%, which is moderately low. The company is retaining the remaining 74%. By the looks of it, the dividend is well covered and MSTC is reinvesting its profits efficiently as evidenced by its exceptional growth which we discussed above.
While MSTC has seen growth in its earnings, it only recently started to pay a dividend. It is most likely that the company decided to impress new and existing shareholders with a dividend.
Conclusion
Overall, we are quite pleased with MSTC's performance. Specifically, we like that the company is reinvesting a huge chunk of its profits at a high rate of return. This of course has caused the company to see substantial growth in its earnings. If the company continues to grow its earnings the way it has, that could have a positive impact on its share price given how earnings per share influence long-term share prices. Remember, the price of a stock is also dependent on the perceived risk. Therefore investors must keep themselves informed about the risks involved before investing in any company. You can see the 2 risks we have identified for MSTC by visiting our risks dashboard for free on our platform here.
New: Manage All Your Stock Portfolios in One Place
We've created the ultimate portfolio companion for stock investors, and it's free.
• Connect an unlimited number of Portfolios and see your total in one currency
• Be alerted to new Warning Signs or Risks via email or mobile
• Track the Fair Value of your stocks
Have feedback on this article? Concerned about the content? Get in touch with us directly. Alternatively, email editorial-team (at) simplywallst.com.
This article by Simply Wall St is general in nature. We provide commentary based on historical data and analyst forecasts only using an unbiased methodology and our articles are not intended to be financial advice. It does not constitute a recommendation to buy or sell any stock, and does not take account of your objectives, or your financial situation. We aim to bring you long-term focused analysis driven by fundamental data. Note that our analysis may not factor in the latest price-sensitive company announcements or qualitative material. Simply Wall St has no position in any stocks mentioned.
About NSEI:MSTCLTD
MSTC
Engages in marketing, e-commerce, and scrap recovery and allied job businesses primarily in India.
Flawless balance sheet with solid track record.
Similar Companies
Market Insights

Advertisement
Community Narratives
MicroVision will explode future revenue by 380.37% with a vision towards success
Fair Value US$60.00|98.5% undervalued
TH
Community Contributor
The Indispensable Artery for a New North American Economy
Fair Value CA$132.87|2.3% undervalued
TI
Community Contributor