- India
- /
- Aerospace & Defense
- /
- NSEI:KRISHNADEF
Krishna Defence and Allied Industries (NSE:KRISHNADEF) Seems To Use Debt Quite Sensibly

The external fund manager backed by Berkshire Hathaway's Charlie Munger, Li Lu, makes no bones about it when he says 'The biggest investment risk is not the volatility of prices, but whether you will suffer a permanent loss of capital.' So it might be obvious that you need to consider debt, when you think about how risky any given stock is, because too much debt can sink a company. We can see that Krishna Defence and Allied Industries Limited (NSE:KRISHNADEF) does use debt in its business. But the real question is whether this debt is making the company risky.
What Risk Does Debt Bring?
Generally speaking, debt only becomes a real problem when a company can't easily pay it off, either by raising capital or with its own cash flow. If things get really bad, the lenders can take control of the business. However, a more frequent (but still costly) occurrence is where a company must issue shares at bargain-basement prices, permanently diluting shareholders, just to shore up its balance sheet. Of course, the upside of debt is that it often represents cheap capital, especially when it replaces dilution in a company with the ability to reinvest at high rates of return. The first step when considering a company's debt levels is to consider its cash and debt together.
Check out our latest analysis for Krishna Defence and Allied Industries
What Is Krishna Defence and Allied Industries's Net Debt?
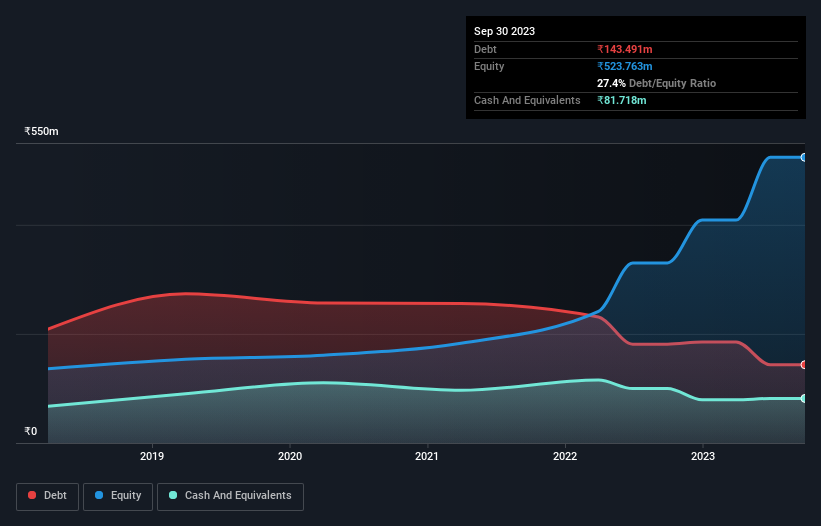
The image below, which you can click on for greater detail, shows that Krishna Defence and Allied Industries had debt of ₹143.5m at the end of September 2023, a reduction from ₹181.2m over a year. However, it also had ₹81.7m in cash, and so its net debt is ₹61.8m.
How Healthy Is Krishna Defence and Allied Industries' Balance Sheet?
We can see from the most recent balance sheet that Krishna Defence and Allied Industries had liabilities of ₹211.8m falling due within a year, and liabilities of ₹36.9m due beyond that. On the other hand, it had cash of ₹81.7m and ₹157.0m worth of receivables due within a year. So its liabilities total ₹10.1m more than the combination of its cash and short-term receivables.
This state of affairs indicates that Krishna Defence and Allied Industries' balance sheet looks quite solid, as its total liabilities are just about equal to its liquid assets. So it's very unlikely that the ₹4.50b company is short on cash, but still worth keeping an eye on the balance sheet. Carrying virtually no net debt, Krishna Defence and Allied Industries has a very light debt load indeed.
We use two main ratios to inform us about debt levels relative to earnings. The first is net debt divided by earnings before interest, tax, depreciation, and amortization (EBITDA), while the second is how many times its earnings before interest and tax (EBIT) covers its interest expense (or its interest cover, for short). This way, we consider both the absolute quantum of the debt, as well as the interest rates paid on it.
Krishna Defence and Allied Industries has a low net debt to EBITDA ratio of only 0.60. And its EBIT covers its interest expense a whopping 13.5 times over. So we're pretty relaxed about its super-conservative use of debt. On top of that, Krishna Defence and Allied Industries grew its EBIT by 68% over the last twelve months, and that growth will make it easier to handle its debt. The balance sheet is clearly the area to focus on when you are analysing debt. But you can't view debt in total isolation; since Krishna Defence and Allied Industries will need earnings to service that debt. So if you're keen to discover more about its earnings, it might be worth checking out this graph of its long term earnings trend.
Finally, a business needs free cash flow to pay off debt; accounting profits just don't cut it. So the logical step is to look at the proportion of that EBIT that is matched by actual free cash flow. During the last three years, Krishna Defence and Allied Industries burned a lot of cash. While that may be a result of expenditure for growth, it does make the debt far more risky.
Our View
Happily, Krishna Defence and Allied Industries's impressive interest cover implies it has the upper hand on its debt. But we must concede we find its conversion of EBIT to free cash flow has the opposite effect. Taking all this data into account, it seems to us that Krishna Defence and Allied Industries takes a pretty sensible approach to debt. That means they are taking on a bit more risk, in the hope of boosting shareholder returns. There's no doubt that we learn most about debt from the balance sheet. However, not all investment risk resides within the balance sheet - far from it. These risks can be hard to spot. Every company has them, and we've spotted 2 warning signs for Krishna Defence and Allied Industries (of which 1 is a bit concerning!) you should know about.
If you're interested in investing in businesses that can grow profits without the burden of debt, then check out this free list of growing businesses that have net cash on the balance sheet.
The New Payments ETF Is Live on NASDAQ:
Money is moving to real-time rails, and a newly listed ETF now gives investors direct exposure. Fast settlement. Institutional custody. Simple access.
Explore how this launch could reshape portfolios
Sponsored ContentValuation is complex, but we're here to simplify it.
Discover if Krishna Defence and Allied Industries might be undervalued or overvalued with our detailed analysis, featuring fair value estimates, potential risks, dividends, insider trades, and its financial condition.
Access Free AnalysisHave feedback on this article? Concerned about the content? Get in touch with us directly. Alternatively, email editorial-team (at) simplywallst.com.
This article by Simply Wall St is general in nature. We provide commentary based on historical data and analyst forecasts only using an unbiased methodology and our articles are not intended to be financial advice. It does not constitute a recommendation to buy or sell any stock, and does not take account of your objectives, or your financial situation. We aim to bring you long-term focused analysis driven by fundamental data. Note that our analysis may not factor in the latest price-sensitive company announcements or qualitative material. Simply Wall St has no position in any stocks mentioned.
About NSEI:KRISHNADEF
Krishna Defence and Allied Industries
Engages in the designing, developing, and manufacturing range of equipment for defence, security, dairy, and kitchen verticals in India.
Flawless balance sheet with solid track record.
Market Insights

Weekly Picks

Early mover in a fast growing industry. Likely to experience share price volatility as they scale


A case for CA$31.80 (undiluted), aka 8,616% upside from CA$0.37 (an 86 bagger!).


Moderation and Stabilisation: HOLD: Fair Price based on a 4-year Cycle is $12.08
Recently Updated Narratives

Airbnb Stock: Platform Growth in a World of Saturation and Scrutiny

Clarivate Stock: When Data Becomes the Backbone of Innovation and Law

Adobe Stock: AI-Fueled ARR Growth Pushes Guidance Higher, But Cost Pressures Loom
Popular Narratives


Crazy Undervalued 42 Baggers Silver Play (Active & Running Mine)


NVDA: Expanding AI Demand Will Drive Major Data Center Investments Through 2026


MicroVision will explode future revenue by 380.37% with a vision towards success
Trending Discussion
