
Advertisement

David Iben put it well when he said, 'Volatility is not a risk we care about. What we care about is avoiding the permanent loss of capital.' So it might be obvious that you need to consider debt, when you think about how risky any given stock is, because too much debt can sink a company. As with many other companies INOX India Limited (NSE:INOXINDIA) makes use of debt. But is this debt a concern to shareholders?
What Risk Does Debt Bring?
Debt assists a business until the business has trouble paying it off, either with new capital or with free cash flow. Part and parcel of capitalism is the process of 'creative destruction' where failed businesses are mercilessly liquidated by their bankers. While that is not too common, we often do see indebted companies permanently diluting shareholders because lenders force them to raise capital at a distressed price. Of course, the upside of debt is that it often represents cheap capital, especially when it replaces dilution in a company with the ability to reinvest at high rates of return. The first step when considering a company's debt levels is to consider its cash and debt together.
View our latest analysis for INOX India
What Is INOX India's Debt?
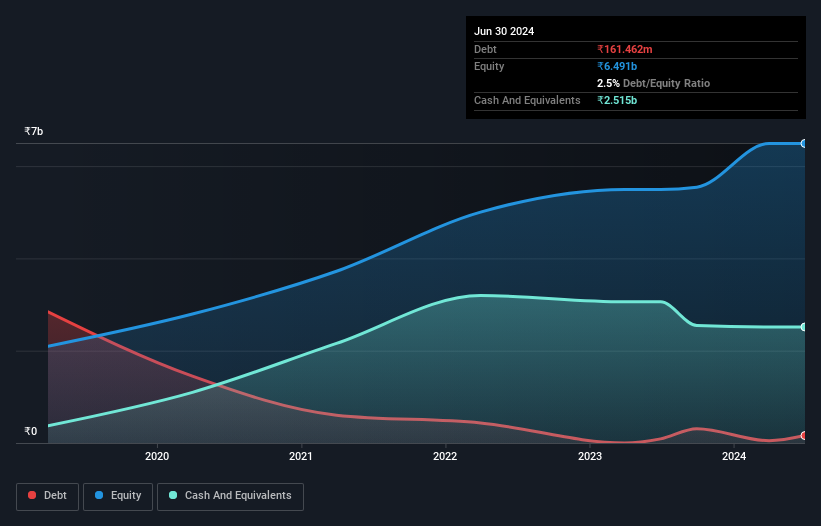
As you can see below, at the end of March 2024, INOX India had ₹161.5m of debt, up from ₹89.9m a year ago. Click the image for more detail. But it also has ₹2.51b in cash to offset that, meaning it has ₹2.35b net cash.
How Strong Is INOX India's Balance Sheet?
According to the last reported balance sheet, INOX India had liabilities of ₹5.19b due within 12 months, and liabilities of ₹309.0m due beyond 12 months. On the other hand, it had cash of ₹2.51b and ₹1.67b worth of receivables due within a year. So its liabilities outweigh the sum of its cash and (near-term) receivables by ₹1.31b.
This state of affairs indicates that INOX India's balance sheet looks quite solid, as its total liabilities are just about equal to its liquid assets. So it's very unlikely that the ₹103.3b company is short on cash, but still worth keeping an eye on the balance sheet. Despite its noteworthy liabilities, INOX India boasts net cash, so it's fair to say it does not have a heavy debt load!
Also good is that INOX India grew its EBIT at 12% over the last year, further increasing its ability to manage debt. The balance sheet is clearly the area to focus on when you are analysing debt. But it is future earnings, more than anything, that will determine INOX India's ability to maintain a healthy balance sheet going forward. So if you want to see what the professionals think, you might find this free report on analyst profit forecasts to be interesting.
Finally, a company can only pay off debt with cold hard cash, not accounting profits. While INOX India has net cash on its balance sheet, it's still worth taking a look at its ability to convert earnings before interest and tax (EBIT) to free cash flow, to help us understand how quickly it is building (or eroding) that cash balance. In the last three years, INOX India's free cash flow amounted to 28% of its EBIT, less than we'd expect. That weak cash conversion makes it more difficult to handle indebtedness.
Summing Up
We could understand if investors are concerned about INOX India's liabilities, but we can be reassured by the fact it has has net cash of ₹2.35b. And it also grew its EBIT by 12% over the last year. So we don't have any problem with INOX India's use of debt. Over time, share prices tend to follow earnings per share, so if you're interested in INOX India, you may well want to click here to check an interactive graph of its earnings per share history.
At the end of the day, it's often better to focus on companies that are free from net debt. You can access our special list of such companies (all with a track record of profit growth). It's free.
New: AI Stock Screener & Alerts
Our new AI Stock Screener scans the market every day to uncover opportunities.
• Dividend Powerhouses (3%+ Yield)
• Undervalued Small Caps with Insider Buying
• High growth Tech and AI Companies
Or build your own from over 50 metrics.
Have feedback on this article? Concerned about the content? Get in touch with us directly. Alternatively, email editorial-team (at) simplywallst.com.
This article by Simply Wall St is general in nature. We provide commentary based on historical data and analyst forecasts only using an unbiased methodology and our articles are not intended to be financial advice. It does not constitute a recommendation to buy or sell any stock, and does not take account of your objectives, or your financial situation. We aim to bring you long-term focused analysis driven by fundamental data. Note that our analysis may not factor in the latest price-sensitive company announcements or qualitative material. Simply Wall St has no position in any stocks mentioned.
About NSEI:INOXINDIA
INOX India
Manufactures and supplies cryogenic liquid storage and transport tanks for gas companies and other customers in India and internationally.
Flawless balance sheet with reasonable growth potential.
Similar Companies
Market Insights

Advertisement
Community Narratives
The Future of Drug Testing? Fingerprint Tech Shows Serious Promise
Fair Value US$2.98|35.9% undervalued
JO
Community Contributor
Occidental Petroleum is set to achieve a 16% profit margin improvement
Fair Value US$55.05|15.6% undervalued
DZ
Community Contributor
Argan's Revenue Set to Soar with a 13.31% Growth in the Coming Decade
Fair Value US$284.68|23.4% undervalued
KE
Community Contributor
EU#1 - From German Startup to EU’s Biggest Company
Fair Value €248.62|2.5% overvalued
TO
Community Contributor