
Advertisement
Honda India Power Products Limited's (NSE:HONDAPOWER) Stock Has Seen Strong Momentum: Does That Call For Deeper Study Of Its Financial Prospects?

Honda India Power Products' (NSE:HONDAPOWER) stock is up by a considerable 29% over the past three months. Given that stock prices are usually aligned with a company's financial performance in the long-term, we decided to study its financial indicators more closely to see if they had a hand to play in the recent price move. In this article, we decided to focus on Honda India Power Products' ROE.
Return on Equity or ROE is a test of how effectively a company is growing its value and managing investors’ money. In short, ROE shows the profit each dollar generates with respect to its shareholder investments.
View our latest analysis for Honda India Power Products
How To Calculate Return On Equity?
ROE can be calculated by using the formula:
Return on Equity = Net Profit (from continuing operations) ÷ Shareholders' Equity
So, based on the above formula, the ROE for Honda India Power Products is:
11% = ₹822m ÷ ₹7.7b (Based on the trailing twelve months to December 2023).
The 'return' is the yearly profit. That means that for every ₹1 worth of shareholders' equity, the company generated ₹0.11 in profit.
What Has ROE Got To Do With Earnings Growth?
So far, we've learned that ROE is a measure of a company's profitability. We now need to evaluate how much profit the company reinvests or "retains" for future growth which then gives us an idea about the growth potential of the company. Generally speaking, other things being equal, firms with a high return on equity and profit retention, have a higher growth rate than firms that don’t share these attributes.
A Side By Side comparison of Honda India Power Products' Earnings Growth And 11% ROE
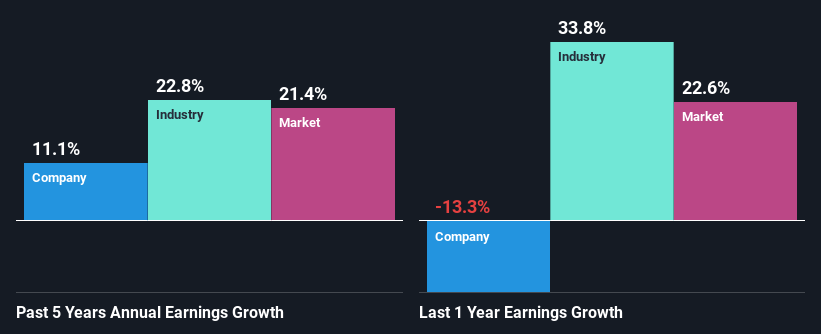
On the face of it, Honda India Power Products' ROE is not much to talk about. We then compared the company's ROE to the broader industry and were disappointed to see that the ROE is lower than the industry average of 17%. Although, we can see that Honda India Power Products saw a modest net income growth of 11% over the past five years. So, the growth in the company's earnings could probably have been caused by other variables. For example, it is possible that the company's management has made some good strategic decisions, or that the company has a low payout ratio.
We then compared Honda India Power Products' net income growth with the industry and found that the company's growth figure is lower than the average industry growth rate of 23% in the same 5-year period, which is a bit concerning.
Earnings growth is an important metric to consider when valuing a stock. It’s important for an investor to know whether the market has priced in the company's expected earnings growth (or decline). This then helps them determine if the stock is placed for a bright or bleak future. If you're wondering about Honda India Power Products''s valuation, check out this gauge of its price-to-earnings ratio, as compared to its industry.
Is Honda India Power Products Using Its Retained Earnings Effectively?
Honda India Power Products has a low three-year median payout ratio of 20%, meaning that the company retains the remaining 80% of its profits. This suggests that the management is reinvesting most of the profits to grow the business.
Besides, Honda India Power Products has been paying dividends for at least ten years or more. This shows that the company is committed to sharing profits with its shareholders.
Summary
In total, it does look like Honda India Power Products has some positive aspects to its business. Namely, its respectable earnings growth, which it achieved due to it retaining most of its profits. However, given the low ROE, investors may not be benefitting from all that reinvestment after all. While we won't completely dismiss the company, what we would do, is try to ascertain how risky the business is to make a more informed decision around the company. Our risks dashboard will have the 1 risk we have identified for Honda India Power Products.
Valuation is complex, but we're here to simplify it.
Discover if Honda India Power Products might be undervalued or overvalued with our detailed analysis, featuring fair value estimates, potential risks, dividends, insider trades, and its financial condition.
Access Free AnalysisHave feedback on this article? Concerned about the content? Get in touch with us directly. Alternatively, email editorial-team (at) simplywallst.com.
This article by Simply Wall St is general in nature. We provide commentary based on historical data and analyst forecasts only using an unbiased methodology and our articles are not intended to be financial advice. It does not constitute a recommendation to buy or sell any stock, and does not take account of your objectives, or your financial situation. We aim to bring you long-term focused analysis driven by fundamental data. Note that our analysis may not factor in the latest price-sensitive company announcements or qualitative material. Simply Wall St has no position in any stocks mentioned.
About NSEI:HONDAPOWER
Honda India Power Products
Engages in the manufacture, marketing, and sale of portable generators, water pumps, general purpose engines, lawn mowers, brush cutters, portable gensets, tillers, and marine engines in India and internationally.
Flawless balance sheet second-rate dividend payer.
Market Insights


Advertisement
Community Narratives
A case for TSXV:USA to reach USD $5.00 - $9.00 (CAD $7.30–$12.29) by 2029.
Fair Value CA$12.29|91.2% undervalued
AG
Community Contributor
DLocal's Future Growth Fueled by 35% Revenue and Profit Margin Boosts
Fair Value US$195.39|94.1% undervalued
WY
Community Contributor
Historically Cheap, but the Margin of Safety Is Still Thin
Fair Value SEK 232.58|12.7% undervalued
MA
Community Contributor