
Advertisement
- India
- /
- Construction
- /
- NSEI:GRINFRA
Does This Valuation Of G R Infraprojects Limited (NSE:GRINFRA) Imply Investors Are Overpaying?
Key Insights
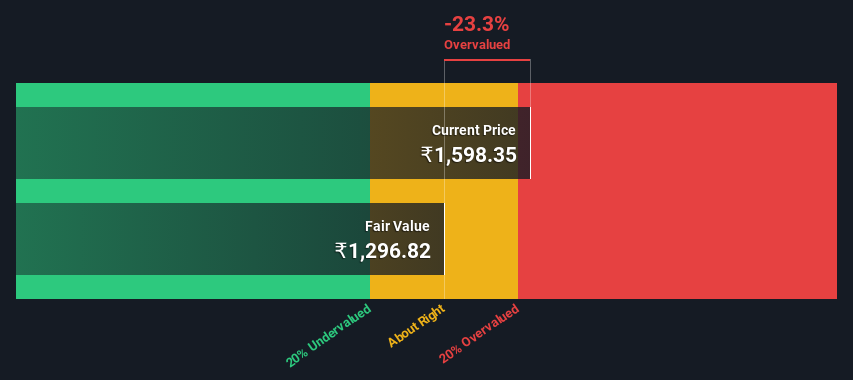
- The projected fair value for G R Infraprojects is ₹1,297 based on 2 Stage Free Cash Flow to Equity
- Current share price of ₹1,598 suggests G R Infraprojects is potentially 23% overvalued
- The ₹1,623 analyst price target for GRINFRA is 25% more than our estimate of fair value
Does the August share price for G R Infraprojects Limited (NSE:GRINFRA) reflect what it's really worth? Today, we will estimate the stock's intrinsic value by projecting its future cash flows and then discounting them to today's value. The Discounted Cash Flow (DCF) model is the tool we will apply to do this. Believe it or not, it's not too difficult to follow, as you'll see from our example!
We generally believe that a company's value is the present value of all of the cash it will generate in the future. However, a DCF is just one valuation metric among many, and it is not without flaws. If you want to learn more about discounted cash flow, the rationale behind this calculation can be read in detail in the Simply Wall St analysis model.
View our latest analysis for G R Infraprojects
Crunching The Numbers
We use what is known as a 2-stage model, which simply means we have two different periods of growth rates for the company's cash flows. Generally the first stage is higher growth, and the second stage is a lower growth phase. To start off with, we need to estimate the next ten years of cash flows. Where possible we use analyst estimates, but when these aren't available we extrapolate the previous free cash flow (FCF) from the last estimate or reported value. We assume companies with shrinking free cash flow will slow their rate of shrinkage, and that companies with growing free cash flow will see their growth rate slow, over this period. We do this to reflect that growth tends to slow more in the early years than it does in later years.
A DCF is all about the idea that a dollar in the future is less valuable than a dollar today, so we need to discount the sum of these future cash flows to arrive at a present value estimate:
10-year free cash flow (FCF) forecast
| 2025 | 2026 | 2027 | 2028 | 2029 | 2030 | 2031 | 2032 | 2033 | 2034 | |
| Levered FCF (₹, Millions) | ₹6.06b | ₹7.42b | ₹9.19b | ₹10.6b | ₹12.0b | ₹13.4b | ₹14.7b | ₹16.0b | ₹17.3b | ₹18.6b |
| Growth Rate Estimate Source | Analyst x5 | Analyst x4 | Analyst x2 | Est @ 15.75% | Est @ 13.04% | Est @ 11.14% | Est @ 9.80% | Est @ 8.87% | Est @ 8.22% | Est @ 7.77% |
| Present Value (₹, Millions) Discounted @ 14% | ₹5.3k | ₹5.7k | ₹6.2k | ₹6.2k | ₹6.2k | ₹6.0k | ₹5.8k | ₹5.5k | ₹5.2k | ₹4.9k |
("Est" = FCF growth rate estimated by Simply Wall St)
Present Value of 10-year Cash Flow (PVCF) = ₹57b
After calculating the present value of future cash flows in the initial 10-year period, we need to calculate the Terminal Value, which accounts for all future cash flows beyond the first stage. The Gordon Growth formula is used to calculate Terminal Value at a future annual growth rate equal to the 5-year average of the 10-year government bond yield of 6.7%. We discount the terminal cash flows to today's value at a cost of equity of 14%.
Terminal Value (TV)= FCF2034 × (1 + g) ÷ (r – g) = ₹19b× (1 + 6.7%) ÷ (14%– 6.7%) = ₹261b
Present Value of Terminal Value (PVTV)= TV / (1 + r)10= ₹261b÷ ( 1 + 14%)10= ₹69b
The total value, or equity value, is then the sum of the present value of the future cash flows, which in this case is ₹125b. To get the intrinsic value per share, we divide this by the total number of shares outstanding. Relative to the current share price of ₹1.6k, the company appears slightly overvalued at the time of writing. Remember though, that this is just an approximate valuation, and like any complex formula - garbage in, garbage out.
Important Assumptions
Now the most important inputs to a discounted cash flow are the discount rate, and of course, the actual cash flows. If you don't agree with these result, have a go at the calculation yourself and play with the assumptions. The DCF also does not consider the possible cyclicality of an industry, or a company's future capital requirements, so it does not give a full picture of a company's potential performance. Given that we are looking at G R Infraprojects as potential shareholders, the cost of equity is used as the discount rate, rather than the cost of capital (or weighted average cost of capital, WACC) which accounts for debt. In this calculation we've used 14%, which is based on a levered beta of 1.119. Beta is a measure of a stock's volatility, compared to the market as a whole. We get our beta from the industry average beta of globally comparable companies, with an imposed limit between 0.8 and 2.0, which is a reasonable range for a stable business.
SWOT Analysis for G R Infraprojects
Strength
- Debt is well covered by earnings.
Weakness
- Earnings declined over the past year.
Opportunity
- Good value based on P/E ratio compared to estimated Fair P/E ratio.
Threat
- Debt is not well covered by operating cash flow.
- Annual earnings are forecast to decline for the next 3 years.
Next Steps:
Although the valuation of a company is important, it ideally won't be the sole piece of analysis you scrutinize for a company. The DCF model is not a perfect stock valuation tool. Preferably you'd apply different cases and assumptions and see how they would impact the company's valuation. For example, changes in the company's cost of equity or the risk free rate can significantly impact the valuation. Why is the intrinsic value lower than the current share price? For G R Infraprojects, we've compiled three additional aspects you should further examine:
- Risks: To that end, you should learn about the 3 warning signs we've spotted with G R Infraprojects (including 2 which can't be ignored) .
- Future Earnings: How does GRINFRA's growth rate compare to its peers and the wider market? Dig deeper into the analyst consensus number for the upcoming years by interacting with our free analyst growth expectation chart.
- Other Solid Businesses: Low debt, high returns on equity and good past performance are fundamental to a strong business. Why not explore our interactive list of stocks with solid business fundamentals to see if there are other companies you may not have considered!
PS. Simply Wall St updates its DCF calculation for every Indian stock every day, so if you want to find the intrinsic value of any other stock just search here.
New: Manage All Your Stock Portfolios in One Place
We've created the ultimate portfolio companion for stock investors, and it's free.
• Connect an unlimited number of Portfolios and see your total in one currency
• Be alerted to new Warning Signs or Risks via email or mobile
• Track the Fair Value of your stocks
Have feedback on this article? Concerned about the content? Get in touch with us directly. Alternatively, email editorial-team (at) simplywallst.com.
This article by Simply Wall St is general in nature. We provide commentary based on historical data and analyst forecasts only using an unbiased methodology and our articles are not intended to be financial advice. It does not constitute a recommendation to buy or sell any stock, and does not take account of your objectives, or your financial situation. We aim to bring you long-term focused analysis driven by fundamental data. Note that our analysis may not factor in the latest price-sensitive company announcements or qualitative material. Simply Wall St has no position in any stocks mentioned.
Have feedback on this article? Concerned about the content? Get in touch with us directly. Alternatively, email editorial-team@simplywallst.com
About NSEI:GRINFRA
G R Infraprojects
Through its subsidiaries, provides engineering, procurement, construction, and project management services for roads and highways, bridges, airport runway, railways and metro, tunneling and hydro, power transmission, multi modal logistic park, and optical fiber cable industries in India.
Good value with adequate balance sheet.
Similar Companies
Market Insights

Advertisement
Community Narratives
The company that turned a verb into a global necessity and basically runs the modern internet, digital ads, smartphones, maps, and AI.
Fair Value US$300.00|10.2% undervalued
OS
Community Contributor
Flowers Foods Pays A Fair Price For Health
Fair Value US$16.12|20.3% undervalued
NV
Community Contributor
TMX Group will thrive with 33.3% profit margin and enduring market moat
Fair Value CA$49.90|0.1% undervalued
LI
Community Contributor