
Advertisement
What You Can Learn From Greenlam Industries Limited's (NSE:GREENLAM) P/E
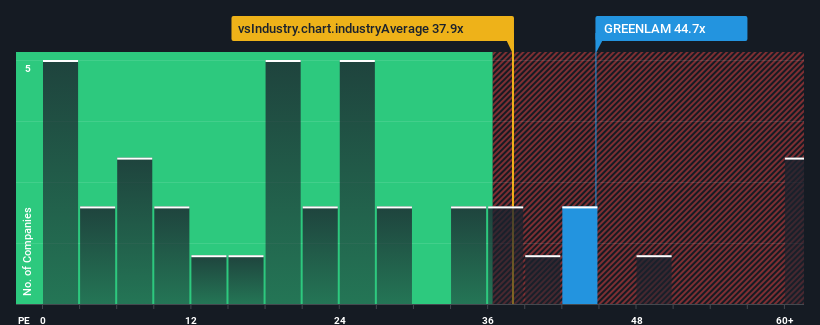
When close to half the companies in India have price-to-earnings ratios (or "P/E's") below 25x, you may consider Greenlam Industries Limited (NSE:GREENLAM) as a stock to avoid entirely with its 52.1x P/E ratio. Nonetheless, we'd need to dig a little deeper to determine if there is a rational basis for the highly elevated P/E.
Greenlam Industries could be doing better as its earnings have been going backwards lately while most other companies have been seeing positive earnings growth. It might be that many expect the dour earnings performance to recover substantially, which has kept the P/E from collapsing. You'd really hope so, otherwise you're paying a pretty hefty price for no particular reason.
Check out our latest analysis for Greenlam Industries
How Is Greenlam Industries' Growth Trending?
The only time you'd be truly comfortable seeing a P/E as steep as Greenlam Industries' is when the company's growth is on track to outshine the market decidedly.
If we review the last year of earnings, dishearteningly the company's profits fell to the tune of 25%. Regardless, EPS has managed to lift by a handy 6.9% in aggregate from three years ago, thanks to the earlier period of growth. So we can start by confirming that the company has generally done a good job of growing earnings over that time, even though it had some hiccups along the way.
Turning to the outlook, the next year should generate growth of 44% as estimated by the analysts watching the company. Meanwhile, the rest of the market is forecast to only expand by 24%, which is noticeably less attractive.
With this information, we can see why Greenlam Industries is trading at such a high P/E compared to the market. Apparently shareholders aren't keen to offload something that is potentially eyeing a more prosperous future.
The Final Word
Typically, we'd caution against reading too much into price-to-earnings ratios when settling on investment decisions, though it can reveal plenty about what other market participants think about the company.
We've established that Greenlam Industries maintains its high P/E on the strength of its forecast growth being higher than the wider market, as expected. Right now shareholders are comfortable with the P/E as they are quite confident future earnings aren't under threat. It's hard to see the share price falling strongly in the near future under these circumstances.
Before you settle on your opinion, we've discovered 3 warning signs for Greenlam Industries (1 is potentially serious!) that you should be aware of.
It's important to make sure you look for a great company, not just the first idea you come across. So take a peek at this free list of interesting companies with strong recent earnings growth (and a low P/E).
New: Manage All Your Stock Portfolios in One Place
We've created the ultimate portfolio companion for stock investors, and it's free.
• Connect an unlimited number of Portfolios and see your total in one currency
• Be alerted to new Warning Signs or Risks via email or mobile
• Track the Fair Value of your stocks
Have feedback on this article? Concerned about the content? Get in touch with us directly. Alternatively, email editorial-team (at) simplywallst.com.
This article by Simply Wall St is general in nature. We provide commentary based on historical data and analyst forecasts only using an unbiased methodology and our articles are not intended to be financial advice. It does not constitute a recommendation to buy or sell any stock, and does not take account of your objectives, or your financial situation. We aim to bring you long-term focused analysis driven by fundamental data. Note that our analysis may not factor in the latest price-sensitive company announcements or qualitative material. Simply Wall St has no position in any stocks mentioned.
About NSEI:GREENLAM
Greenlam Industries
Manufactures and sells laminates, decorative veneers, and related allied products in India and internationally.
Reasonable growth potential and slightly overvalued.
Similar Companies
Market Insights

Advertisement
Community Narratives
Finding The True Value Of A Logistics Powerhouse
Fair Value US$95.21|8.4% undervalued
NV
Community Contributor
Paradigm Biopharmaceuticals Will Lead Osteoarthritis Treatment with Zilosul's FDA Success
Fair Value AU$5.50|92.1% undervalued
AM
Community Contributor
Barrick Mining (ABX:CA): A Gold Hedge against a U.S. Shutdown
Fair Value CA$60.00|24.2% undervalued
GM
Community Contributor