
Advertisement
- India
- /
- Electrical
- /
- NSEI:GRAPHITE
Graphite India (NSE:GRAPHITE) investors are up 8.2% in the past week, but earnings have declined over the last five years

When you buy and hold a stock for the long term, you definitely want it to provide a positive return. Furthermore, you'd generally like to see the share price rise faster than the market. But Graphite India Limited (NSE:GRAPHITE) has fallen short of that second goal, with a share price rise of 98% over five years, which is below the market return. Zooming in, the stock is up a respectable 18% in the last year.
After a strong gain in the past week, it's worth seeing if longer term returns have been driven by improving fundamentals.
View our latest analysis for Graphite India
While the efficient markets hypothesis continues to be taught by some, it has been proven that markets are over-reactive dynamic systems, and investors are not always rational. One way to examine how market sentiment has changed over time is to look at the interaction between a company's share price and its earnings per share (EPS).
During five years of share price growth, Graphite India actually saw its EPS drop 17% per year.
Essentially, it doesn't seem likely that investors are focused on EPS. Because earnings per share don't seem to match up with the share price, we'll take a look at other metrics instead.
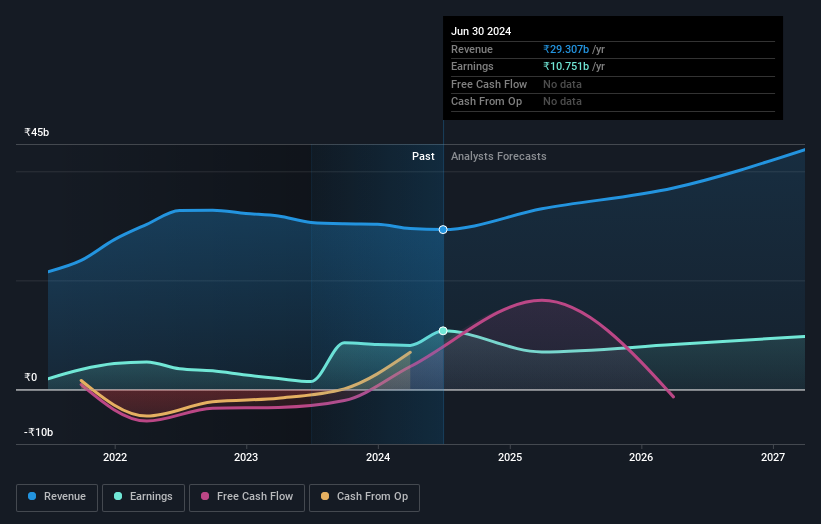
We doubt the modest 1.9% dividend yield is attracting many buyers to the stock. The revenue reduction of 8.3% per year is not a positive. So it seems one might have to take closer look at earnings and revenue trends to see how they might influence the share price.
The company's revenue and earnings (over time) are depicted in the image below (click to see the exact numbers).
We're pleased to report that the CEO is remunerated more modestly than most CEOs at similarly capitalized companies. It's always worth keeping an eye on CEO pay, but a more important question is whether the company will grow earnings throughout the years. So we recommend checking out this free report showing consensus forecasts
What About Dividends?
It is important to consider the total shareholder return, as well as the share price return, for any given stock. Whereas the share price return only reflects the change in the share price, the TSR includes the value of dividends (assuming they were reinvested) and the benefit of any discounted capital raising or spin-off. Arguably, the TSR gives a more comprehensive picture of the return generated by a stock. In the case of Graphite India, it has a TSR of 116% for the last 5 years. That exceeds its share price return that we previously mentioned. This is largely a result of its dividend payments!
A Different Perspective
Graphite India shareholders gained a total return of 20% during the year. Unfortunately this falls short of the market return. The silver lining is that the gain was actually better than the average annual return of 17% per year over five year. This suggests the company might be improving over time. It's always interesting to track share price performance over the longer term. But to understand Graphite India better, we need to consider many other factors. Consider for instance, the ever-present spectre of investment risk. We've identified 3 warning signs with Graphite India (at least 1 which can't be ignored) , and understanding them should be part of your investment process.
But note: Graphite India may not be the best stock to buy. So take a peek at this free list of interesting companies with past earnings growth (and further growth forecast).
Please note, the market returns quoted in this article reflect the market weighted average returns of stocks that currently trade on Indian exchanges.
New: Manage All Your Stock Portfolios in One Place
We've created the ultimate portfolio companion for stock investors, and it's free.
• Connect an unlimited number of Portfolios and see your total in one currency
• Be alerted to new Warning Signs or Risks via email or mobile
• Track the Fair Value of your stocks
Have feedback on this article? Concerned about the content? Get in touch with us directly. Alternatively, email editorial-team (at) simplywallst.com.
This article by Simply Wall St is general in nature. We provide commentary based on historical data and analyst forecasts only using an unbiased methodology and our articles are not intended to be financial advice. It does not constitute a recommendation to buy or sell any stock, and does not take account of your objectives, or your financial situation. We aim to bring you long-term focused analysis driven by fundamental data. Note that our analysis may not factor in the latest price-sensitive company announcements or qualitative material. Simply Wall St has no position in any stocks mentioned.
About NSEI:GRAPHITE
Graphite India
Manufactures and sells graphite electrodes, and carbon and graphite specialty products in India and internationally.
Flawless balance sheet established dividend payer.
Similar Companies
Market Insights


Advertisement
Community Narratives
A case for TSXV:USA to reach USD $5.00 - $9.00 (CAD $7.30–$12.29) by 2029.
Fair Value CA$12.29|91.2% undervalued
AG
Community Contributor
DLocal's Future Growth Fueled by 35% Revenue and Profit Margin Boosts
Fair Value US$195.39|94.1% undervalued
WY
Community Contributor
Historically Cheap, but the Margin of Safety Is Still Thin
Fair Value SEK 232.58|12.7% undervalued
MA
Community Contributor