
Advertisement
- India
- /
- Industrials
- /
- NSEI:GODREJIND
Be Wary Of Godrej Industries (NSE:GODREJIND) And Its Returns On Capital
There are a few key trends to look for if we want to identify the next multi-bagger. Typically, we'll want to notice a trend of growing return on capital employed (ROCE) and alongside that, an expanding base of capital employed. Ultimately, this demonstrates that it's a business that is reinvesting profits at increasing rates of return. Having said that, from a first glance at Godrej Industries (NSE:GODREJIND) we aren't jumping out of our chairs at how returns are trending, but let's have a deeper look.
What is Return On Capital Employed (ROCE)?
For those that aren't sure what ROCE is, it measures the amount of pre-tax profits a company can generate from the capital employed in its business. To calculate this metric for Godrej Industries, this is the formula:
Return on Capital Employed = Earnings Before Interest and Tax (EBIT) ÷ (Total Assets - Current Liabilities)
0.048 = ₹8.4b ÷ (₹312b - ₹138b) (Based on the trailing twelve months to September 2021).
Thus, Godrej Industries has an ROCE of 4.8%. Ultimately, that's a low return and it under-performs the Industrials industry average of 9.6%.
Check out our latest analysis for Godrej Industries
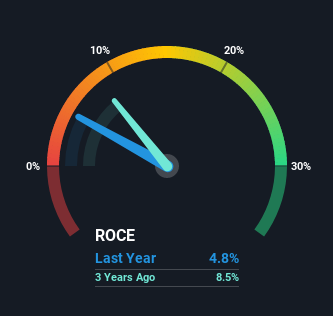
Historical performance is a great place to start when researching a stock so above you can see the gauge for Godrej Industries' ROCE against it's prior returns. If you're interested in investigating Godrej Industries' past further, check out this free graph of past earnings, revenue and cash flow.
The Trend Of ROCE
On the surface, the trend of ROCE at Godrej Industries doesn't inspire confidence. Over the last five years, returns on capital have decreased to 4.8% from 10% five years ago. On the other hand, the company has been employing more capital without a corresponding improvement in sales in the last year, which could suggest these investments are longer term plays. It may take some time before the company starts to see any change in earnings from these investments.
On a related note, Godrej Industries has decreased its current liabilities to 44% of total assets. So we could link some of this to the decrease in ROCE. What's more, this can reduce some aspects of risk to the business because now the company's suppliers or short-term creditors are funding less of its operations. Some would claim this reduces the business' efficiency at generating ROCE since it is now funding more of the operations with its own money. Keep in mind 44% is still pretty high, so those risks are still somewhat prevalent.
What We Can Learn From Godrej Industries' ROCE
To conclude, we've found that Godrej Industries is reinvesting in the business, but returns have been falling. Since the stock has gained an impressive 60% over the last five years, investors must think there's better things to come. Ultimately, if the underlying trends persist, we wouldn't hold our breath on it being a multi-bagger going forward.
Godrej Industries does have some risks though, and we've spotted 1 warning sign for Godrej Industries that you might be interested in.
For those who like to invest in solid companies, check out this free list of companies with solid balance sheets and high returns on equity.
New: Manage All Your Stock Portfolios in One Place
We've created the ultimate portfolio companion for stock investors, and it's free.
• Connect an unlimited number of Portfolios and see your total in one currency
• Be alerted to new Warning Signs or Risks via email or mobile
• Track the Fair Value of your stocks
This article by Simply Wall St is general in nature. We provide commentary based on historical data and analyst forecasts only using an unbiased methodology and our articles are not intended to be financial advice. It does not constitute a recommendation to buy or sell any stock, and does not take account of your objectives, or your financial situation. We aim to bring you long-term focused analysis driven by fundamental data. Note that our analysis may not factor in the latest price-sensitive company announcements or qualitative material. Simply Wall St has no position in any stocks mentioned.
Have feedback on this article? Concerned about the content? Get in touch with us directly. Alternatively, email editorial-team (at) simplywallst.com.
About NSEI:GODREJIND
Godrej Industries
Engages in the chemical, agriculture, real estate, vegetable oil, hospitality, and financial and investment businesses in India and internationally.
Proven track record with imperfect balance sheet.
Similar Companies
Market Insights

Advertisement
Community Narratives
MINISO's fair value is projected at 26.69 with an anticipated PE ratio shift of 20x
Fair Value US$24.03|11.0% undervalued
BE
Community Contributor
Procter & Gamble: A Dividend Giant Facing Slowing Growth
Fair Value US$119.81|23.3% overvalued
AN
Community Contributor
Eli Lilly's Future Growth Driven by Tirzepatide and Favorable Market Conditions
Fair Value US$1.19k|13.8% undervalued
EA
Community Contributor