
Advertisement
- India
- /
- Aerospace & Defense
- /
- NSEI:DATAPATTNS
There's Been No Shortage Of Growth Recently For Data Patterns (India)'s (NSE:DATAPATTNS) Returns On Capital

If you're not sure where to start when looking for the next multi-bagger, there are a few key trends you should keep an eye out for. Amongst other things, we'll want to see two things; firstly, a growing return on capital employed (ROCE) and secondly, an expansion in the company's amount of capital employed. If you see this, it typically means it's a company with a great business model and plenty of profitable reinvestment opportunities. Speaking of which, we noticed some great changes in Data Patterns (India)'s (NSE:DATAPATTNS) returns on capital, so let's have a look.
What Is Return On Capital Employed (ROCE)?
For those who don't know, ROCE is a measure of a company's yearly pre-tax profit (its return), relative to the capital employed in the business. Analysts use this formula to calculate it for Data Patterns (India):
Return on Capital Employed = Earnings Before Interest and Tax (EBIT) ÷ (Total Assets - Current Liabilities)
0.19 = ₹2.5b ÷ (₹17b - ₹3.5b) (Based on the trailing twelve months to March 2024).
Therefore, Data Patterns (India) has an ROCE of 19%. In absolute terms, that's a pretty normal return, and it's somewhat close to the Aerospace & Defense industry average of 16%.
Check out our latest analysis for Data Patterns (India)
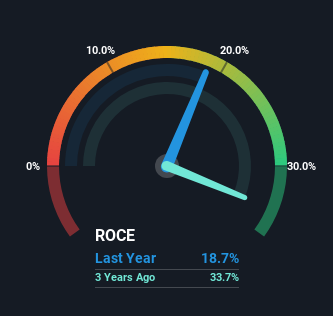
Above you can see how the current ROCE for Data Patterns (India) compares to its prior returns on capital, but there's only so much you can tell from the past. If you're interested, you can view the analysts predictions in our free analyst report for Data Patterns (India) .
The Trend Of ROCE
Investors would be pleased with what's happening at Data Patterns (India). The numbers show that in the last five years, the returns generated on capital employed have grown considerably to 19%. The company is effectively making more money per dollar of capital used, and it's worth noting that the amount of capital has increased too, by 690%. This can indicate that there's plenty of opportunities to invest capital internally and at ever higher rates, a combination that's common among multi-baggers.
In another part of our analysis, we noticed that the company's ratio of current liabilities to total assets decreased to 21%, which broadly means the business is relying less on its suppliers or short-term creditors to fund its operations. So this improvement in ROCE has come from the business' underlying economics, which is great to see.
The Key Takeaway
To sum it up, Data Patterns (India) has proven it can reinvest in the business and generate higher returns on that capital employed, which is terrific. And investors seem to expect more of this going forward, since the stock has rewarded shareholders with a 100% return over the last year. Therefore, we think it would be worth your time to check if these trends are going to continue.
On a separate note, we've found 2 warning signs for Data Patterns (India) you'll probably want to know about.
If you want to search for solid companies with great earnings, check out this free list of companies with good balance sheets and impressive returns on equity.
New: Manage All Your Stock Portfolios in One Place
We've created the ultimate portfolio companion for stock investors, and it's free.
• Connect an unlimited number of Portfolios and see your total in one currency
• Be alerted to new Warning Signs or Risks via email or mobile
• Track the Fair Value of your stocks
Have feedback on this article? Concerned about the content? Get in touch with us directly. Alternatively, email editorial-team (at) simplywallst.com.
This article by Simply Wall St is general in nature. We provide commentary based on historical data and analyst forecasts only using an unbiased methodology and our articles are not intended to be financial advice. It does not constitute a recommendation to buy or sell any stock, and does not take account of your objectives, or your financial situation. We aim to bring you long-term focused analysis driven by fundamental data. Note that our analysis may not factor in the latest price-sensitive company announcements or qualitative material. Simply Wall St has no position in any stocks mentioned.
About NSEI:DATAPATTNS
Data Patterns (India)
Provides defense and aerospace electronics solutions in India.
Flawless balance sheet with high growth potential.
Market Insights


Advertisement
Community Narratives
A case for TSXV:USA to reach USD $5.00 - $9.00 (CAD $7.30–$12.29) by 2029.
Fair Value CA$12.29|91.1% undervalued
AG
Community Contributor
DLocal's Future Growth Fueled by 35% Revenue and Profit Margin Boosts
Fair Value US$195.39|94.2% undervalued
WY
Community Contributor
Historically Cheap, but the Margin of Safety Is Still Thin
Fair Value SEK 232.58|13.2% undervalued
MA
Community Contributor