
Advertisement
- India
- /
- Aerospace & Defense
- /
- NSEI:APOLLO
Is Apollo Micro Systems Limited's (NSE:APOLLO) Recent Stock Performance Influenced By Its Fundamentals In Any Way?

Most readers would already be aware that Apollo Micro Systems' (NSE:APOLLO) stock increased significantly by 33% over the past three months. We wonder if and what role the company's financials play in that price change as a company's long-term fundamentals usually dictate market outcomes. In this article, we decided to focus on Apollo Micro Systems' ROE.
Return on Equity or ROE is a test of how effectively a company is growing its value and managing investors’ money. In short, ROE shows the profit each dollar generates with respect to its shareholder investments.
How To Calculate Return On Equity?
ROE can be calculated by using the formula:
Return on Equity = Net Profit (from continuing operations) ÷ Shareholders' Equity
So, based on the above formula, the ROE for Apollo Micro Systems is:
9.6% = ₹553m ÷ ₹5.8b (Based on the trailing twelve months to December 2024).
The 'return' is the yearly profit. So, this means that for every ₹1 of its shareholder's investments, the company generates a profit of ₹0.10.
View our latest analysis for Apollo Micro Systems
Why Is ROE Important For Earnings Growth?
We have already established that ROE serves as an efficient profit-generating gauge for a company's future earnings. Based on how much of its profits the company chooses to reinvest or "retain", we are then able to evaluate a company's future ability to generate profits. Assuming everything else remains unchanged, the higher the ROE and profit retention, the higher the growth rate of a company compared to companies that don't necessarily bear these characteristics.
Apollo Micro Systems' Earnings Growth And 9.6% ROE
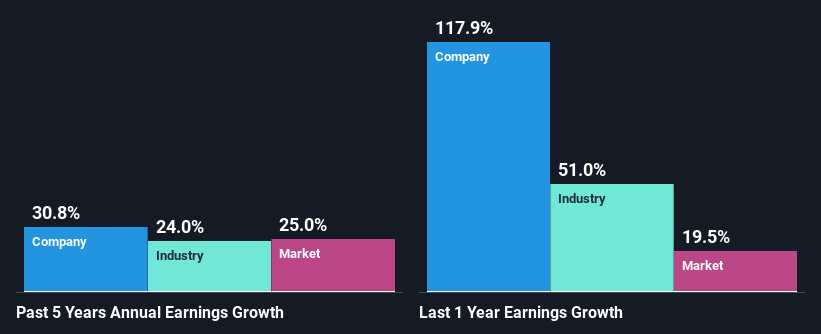
At first glance, Apollo Micro Systems' ROE doesn't look very promising. Next, when compared to the average industry ROE of 15%, the company's ROE leaves us feeling even less enthusiastic. Despite this, surprisingly, Apollo Micro Systems saw an exceptional 31% net income growth over the past five years. Therefore, there could be other reasons behind this growth. For instance, the company has a low payout ratio or is being managed efficiently.
As a next step, we compared Apollo Micro Systems' net income growth with the industry, and pleasingly, we found that the growth seen by the company is higher than the average industry growth of 24%.
The basis for attaching value to a company is, to a great extent, tied to its earnings growth. The investor should try to establish if the expected growth or decline in earnings, whichever the case may be, is priced in. This then helps them determine if the stock is placed for a bright or bleak future. One good indicator of expected earnings growth is the P/E ratio which determines the price the market is willing to pay for a stock based on its earnings prospects. So, you may want to check if Apollo Micro Systems is trading on a high P/E or a low P/E, relative to its industry.
Is Apollo Micro Systems Making Efficient Use Of Its Profits?
Apollo Micro Systems has a really low three-year median payout ratio of 3.1%, meaning that it has the remaining 97% left over to reinvest into its business. So it looks like Apollo Micro Systems is reinvesting profits heavily to grow its business, which shows in its earnings growth.
Additionally, Apollo Micro Systems has paid dividends over a period of six years which means that the company is pretty serious about sharing its profits with shareholders.
Conclusion
In total, it does look like Apollo Micro Systems has some positive aspects to its business. With a high rate of reinvestment, albeit at a low ROE, the company has managed to see a considerable growth in its earnings. With that said, the latest industry analyst forecasts reveal that the company's earnings are expected to accelerate. To know more about the latest analysts predictions for the company, check out this visualization of analyst forecasts for the company.
New: Manage All Your Stock Portfolios in One Place
We've created the ultimate portfolio companion for stock investors, and it's free.
• Connect an unlimited number of Portfolios and see your total in one currency
• Be alerted to new Warning Signs or Risks via email or mobile
• Track the Fair Value of your stocks
Have feedback on this article? Concerned about the content? Get in touch with us directly. Alternatively, email editorial-team (at) simplywallst.com.
This article by Simply Wall St is general in nature. We provide commentary based on historical data and analyst forecasts only using an unbiased methodology and our articles are not intended to be financial advice. It does not constitute a recommendation to buy or sell any stock, and does not take account of your objectives, or your financial situation. We aim to bring you long-term focused analysis driven by fundamental data. Note that our analysis may not factor in the latest price-sensitive company announcements or qualitative material. Simply Wall St has no position in any stocks mentioned.
About NSEI:APOLLO
Apollo Micro Systems
Designs, develops, and assembles electronic and electro-mechanical solutions in India.
High growth potential with solid track record.
Similar Companies
Market Insights


Advertisement
Community Narratives
MicroStrategy: Volatile Gamble or Golden Opportunity?
Fair Value US$663.00|31.2% undervalued
BL
Community Contributor
Emerging Markets and Debt Reduction Will Propel Bath & Body Works Forward
Fair Value US$40.73|24.4% undervalued
ZW
Community Contributor
An amazing opportunity to potentially get a 100 bagger
Fair Value US$10.00|13.5% overvalued
DA
Community Contributor