
Advertisement
- India
- /
- Construction
- /
- NSEI:AHLUCONT
We're Watching These Trends At Ahluwalia Contracts (India) (NSE:AHLUCONT)

There are a few key trends to look for if we want to identify the next multi-bagger. Amongst other things, we'll want to see two things; firstly, a growing return on capital employed (ROCE) and secondly, an expansion in the company's amount of capital employed. Put simply, these types of businesses are compounding machines, meaning they are continually reinvesting their earnings at ever-higher rates of return. In light of that, when we looked at Ahluwalia Contracts (India) (NSE:AHLUCONT) and its ROCE trend, we weren't exactly thrilled.
What is Return On Capital Employed (ROCE)?
For those who don't know, ROCE is a measure of a company's yearly pre-tax profit (its return), relative to the capital employed in the business. Analysts use this formula to calculate it for Ahluwalia Contracts (India):
Return on Capital Employed = Earnings Before Interest and Tax (EBIT) ÷ (Total Assets - Current Liabilities)
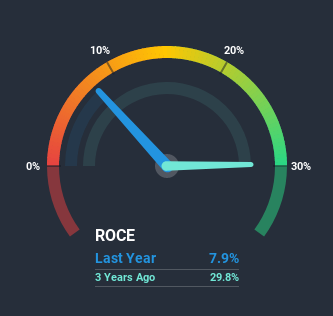
0.079 = ₹767m ÷ (₹18b - ₹8.6b) (Based on the trailing twelve months to December 2020).
Therefore, Ahluwalia Contracts (India) has an ROCE of 7.9%. On its own, that's a low figure but it's around the 9.1% average generated by the Construction industry.
View our latest analysis for Ahluwalia Contracts (India)
In the above chart we have measured Ahluwalia Contracts (India)'s prior ROCE against its prior performance, but the future is arguably more important. If you'd like, you can check out the forecasts from the analysts covering Ahluwalia Contracts (India) here for free.
So How Is Ahluwalia Contracts (India)'s ROCE Trending?
On the surface, the trend of ROCE at Ahluwalia Contracts (India) doesn't inspire confidence. Over the last five years, returns on capital have decreased to 7.9% from 29% five years ago. Meanwhile, the business is utilizing more capital but this hasn't moved the needle much in terms of sales in the past 12 months, so this could reflect longer term investments. It may take some time before the company starts to see any change in earnings from these investments.
On a related note, Ahluwalia Contracts (India) has decreased its current liabilities to 47% of total assets. That could partly explain why the ROCE has dropped. Effectively this means their suppliers or short-term creditors are funding less of the business, which reduces some elements of risk. Some would claim this reduces the business' efficiency at generating ROCE since it is now funding more of the operations with its own money. Keep in mind 47% is still pretty high, so those risks are still somewhat prevalent.
The Key Takeaway
Bringing it all together, while we're somewhat encouraged by Ahluwalia Contracts (India)'s reinvestment in its own business, we're aware that returns are shrinking. And investors may be recognizing these trends since the stock has only returned a total of 21% to shareholders over the last five years. So if you're looking for a multi-bagger, the underlying trends indicate you may have better chances elsewhere.
One more thing to note, we've identified 1 warning sign with Ahluwalia Contracts (India) and understanding it should be part of your investment process.
If you want to search for solid companies with great earnings, check out this free list of companies with good balance sheets and impressive returns on equity.
When trading Ahluwalia Contracts (India) or any other investment, use the platform considered by many to be the Professional's Gateway to the Worlds Market, Interactive Brokers. You get the lowest-cost* trading on stocks, options, futures, forex, bonds and funds worldwide from a single integrated account. Promoted
New: Manage All Your Stock Portfolios in One Place
We've created the ultimate portfolio companion for stock investors, and it's free.
• Connect an unlimited number of Portfolios and see your total in one currency
• Be alerted to new Warning Signs or Risks via email or mobile
• Track the Fair Value of your stocks
This article by Simply Wall St is general in nature. It does not constitute a recommendation to buy or sell any stock, and does not take account of your objectives, or your financial situation. We aim to bring you long-term focused analysis driven by fundamental data. Note that our analysis may not factor in the latest price-sensitive company announcements or qualitative material. Simply Wall St has no position in any stocks mentioned.
*Interactive Brokers Rated Lowest Cost Broker by StockBrokers.com Annual Online Review 2020
Have feedback on this article? Concerned about the content? Get in touch with us directly. Alternatively, email editorial-team (at) simplywallst.com.
About NSEI:AHLUCONT
Ahluwalia Contracts (India)
Operates as an engineering, procurement, and construction company in India.
Flawless balance sheet with reasonable growth potential.
Similar Companies
Market Insights


Advertisement
Community Narratives
A case for TSXV:USA to reach USD $5.00 - $9.00 (CAD $7.30–$12.29) by 2029.
Fair Value CA$12.29|91.2% undervalued
AG
Community Contributor
DLocal's Future Growth Fueled by 35% Revenue and Profit Margin Boosts
Fair Value US$195.39|94.1% undervalued
WY
Community Contributor
Historically Cheap, but the Margin of Safety Is Still Thin
Fair Value SEK 232.58|13.2% undervalued
MA
Community Contributor