
Advertisement
- India
- /
- Construction
- /
- NSEI:AFCONS
Calculating The Fair Value Of Afcons Infrastructure Limited (NSE:AFCONS)

Key Insights
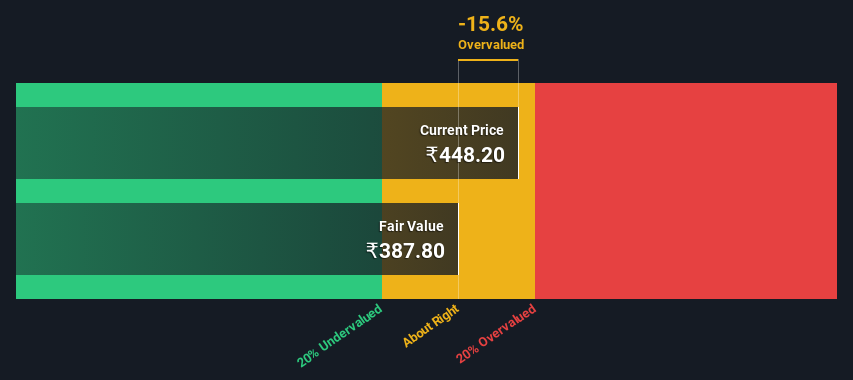
- Using the 2 Stage Free Cash Flow to Equity, Afcons Infrastructure fair value estimate is ₹388
- With ₹448 share price, Afcons Infrastructure appears to be trading close to its estimated fair value
- The ₹583 analyst price target for AFCONS is 50% more than our estimate of fair value
In this article we are going to estimate the intrinsic value of Afcons Infrastructure Limited (NSE:AFCONS) by taking the expected future cash flows and discounting them to their present value. We will take advantage of the Discounted Cash Flow (DCF) model for this purpose. It may sound complicated, but actually it is quite simple!
Companies can be valued in a lot of ways, so we would point out that a DCF is not perfect for every situation. If you want to learn more about discounted cash flow, the rationale behind this calculation can be read in detail in the Simply Wall St analysis model.
Check out our latest analysis for Afcons Infrastructure
The Method
We use what is known as a 2-stage model, which simply means we have two different periods of growth rates for the company's cash flows. Generally the first stage is higher growth, and the second stage is a lower growth phase. To begin with, we have to get estimates of the next ten years of cash flows. Where possible we use analyst estimates, but when these aren't available we extrapolate the previous free cash flow (FCF) from the last estimate or reported value. We assume companies with shrinking free cash flow will slow their rate of shrinkage, and that companies with growing free cash flow will see their growth rate slow, over this period. We do this to reflect that growth tends to slow more in the early years than it does in later years.
Generally we assume that a dollar today is more valuable than a dollar in the future, and so the sum of these future cash flows is then discounted to today's value:
10-year free cash flow (FCF) forecast
| 2025 | 2026 | 2027 | 2028 | 2029 | 2030 | 2031 | 2032 | 2033 | 2034 | |
| Levered FCF (₹, Millions) | ₹1.54b | ₹3.37b | ₹6.62b | ₹9.53b | ₹12.7b | ₹15.8b | ₹18.9b | ₹21.8b | ₹24.7b | ₹27.4b |
| Growth Rate Estimate Source | Analyst x3 | Analyst x3 | Analyst x3 | Est @ 43.94% | Est @ 32.78% | Est @ 24.96% | Est @ 19.49% | Est @ 15.66% | Est @ 12.98% | Est @ 11.10% |
| Present Value (₹, Millions) Discounted @ 15% | ₹1.3k | ₹2.5k | ₹4.4k | ₹5.5k | ₹6.3k | ₹6.8k | ₹7.1k | ₹7.2k | ₹7.0k | ₹6.8k |
("Est" = FCF growth rate estimated by Simply Wall St)
Present Value of 10-year Cash Flow (PVCF) = ₹55b
After calculating the present value of future cash flows in the initial 10-year period, we need to calculate the Terminal Value, which accounts for all future cash flows beyond the first stage. The Gordon Growth formula is used to calculate Terminal Value at a future annual growth rate equal to the 5-year average of the 10-year government bond yield of 6.7%. We discount the terminal cash flows to today's value at a cost of equity of 15%.
Terminal Value (TV)= FCF2034 × (1 + g) ÷ (r – g) = ₹27b× (1 + 6.7%) ÷ (15%– 6.7%) = ₹354b
Present Value of Terminal Value (PVTV)= TV / (1 + r)10= ₹354b÷ ( 1 + 15%)10= ₹88b
The total value, or equity value, is then the sum of the present value of the future cash flows, which in this case is ₹143b. In the final step we divide the equity value by the number of shares outstanding. Relative to the current share price of ₹448, the company appears around fair value at the time of writing. The assumptions in any calculation have a big impact on the valuation, so it is better to view this as a rough estimate, not precise down to the last cent.
The Assumptions
The calculation above is very dependent on two assumptions. The first is the discount rate and the other is the cash flows. Part of investing is coming up with your own evaluation of a company's future performance, so try the calculation yourself and check your own assumptions. The DCF also does not consider the possible cyclicality of an industry, or a company's future capital requirements, so it does not give a full picture of a company's potential performance. Given that we are looking at Afcons Infrastructure as potential shareholders, the cost of equity is used as the discount rate, rather than the cost of capital (or weighted average cost of capital, WACC) which accounts for debt. In this calculation we've used 15%, which is based on a levered beta of 1.138. Beta is a measure of a stock's volatility, compared to the market as a whole. We get our beta from the industry average beta of globally comparable companies, with an imposed limit between 0.8 and 2.0, which is a reasonable range for a stable business.
SWOT Analysis for Afcons Infrastructure
Strength
- Earnings growth over the past year exceeded its 5-year average.
Weakness
- Earnings growth over the past year underperformed the Construction industry.
- Interest payments on debt are not well covered.
- Current share price is above our estimate of fair value.
Opportunity
- Annual earnings are forecast to grow faster than the Indian market.
Threat
- Debt is not well covered by operating cash flow.
- Revenue is forecast to grow slower than 20% per year.
Looking Ahead:
Although the valuation of a company is important, it ideally won't be the sole piece of analysis you scrutinize for a company. It's not possible to obtain a foolproof valuation with a DCF model. Instead the best use for a DCF model is to test certain assumptions and theories to see if they would lead to the company being undervalued or overvalued. For instance, if the terminal value growth rate is adjusted slightly, it can dramatically alter the overall result. For Afcons Infrastructure, we've compiled three relevant aspects you should further research:
- Risks: Every company has them, and we've spotted 1 warning sign for Afcons Infrastructure you should know about.
- Management:Have insiders been ramping up their shares to take advantage of the market's sentiment for AFCONS's future outlook? Check out our management and board analysis with insights on CEO compensation and governance factors.
- Other Solid Businesses: Low debt, high returns on equity and good past performance are fundamental to a strong business. Why not explore our interactive list of stocks with solid business fundamentals to see if there are other companies you may not have considered!
PS. Simply Wall St updates its DCF calculation for every Indian stock every day, so if you want to find the intrinsic value of any other stock just search here.
New: Manage All Your Stock Portfolios in One Place
We've created the ultimate portfolio companion for stock investors, and it's free.
• Connect an unlimited number of Portfolios and see your total in one currency
• Be alerted to new Warning Signs or Risks via email or mobile
• Track the Fair Value of your stocks
Have feedback on this article? Concerned about the content? Get in touch with us directly. Alternatively, email editorial-team (at) simplywallst.com.
This article by Simply Wall St is general in nature. We provide commentary based on historical data and analyst forecasts only using an unbiased methodology and our articles are not intended to be financial advice. It does not constitute a recommendation to buy or sell any stock, and does not take account of your objectives, or your financial situation. We aim to bring you long-term focused analysis driven by fundamental data. Note that our analysis may not factor in the latest price-sensitive company announcements or qualitative material. Simply Wall St has no position in any stocks mentioned.
About NSEI:AFCONS
Afcons Infrastructure
Engages in infrastructure, engineering, and construction business.
Excellent balance sheet with reasonable growth potential.
Similar Companies
Market Insights


Advertisement
Community Narratives
A Quality Compounder Marked Down on Overblown Fears
Fair Value US$120.72|62.4% undervalued
BA
Community Contributor

Wyndham Continues Global Expansion with 19% Ancillary Revenue Growth
Fair Value US$105.80|19.2% undervalued
ZW
Community Contributor