
Advertisement
Here's What City Union Bank Limited's (NSE:CUB) P/E Ratio Is Telling Us

Want to participate in a short research study? Help shape the future of investing tools and receive a $20 prize!
The goal of this article is to teach you how to use price to earnings ratios (P/E ratios). We'll look at City Union Bank Limited's (NSE:CUB) P/E ratio and reflect on what it tells us about the company's share price. Based on the last twelve months, City Union Bank's P/E ratio is 19.13. That means that at current prices, buyers pay ₹19.13 for every ₹1 in trailing yearly profits.
View our latest analysis for City Union Bank
How Do You Calculate City Union Bank's P/E Ratio?
The formula for price to earnings is:
Price to Earnings Ratio = Price per Share ÷ Earnings per Share (EPS)
Or for City Union Bank:
P/E of 19.13 = ₹177 ÷ ₹9.25 (Based on the trailing twelve months to December 2018.)
Is A High P/E Ratio Good?
A higher P/E ratio implies that investors pay a higher price for the earning power of the business. That is not a good or a bad thing per se, but a high P/E does imply buyers are optimistic about the future.
How Growth Rates Impact P/E Ratios
Probably the most important factor in determining what P/E a company trades on is the earnings growth. That's because companies that grow earnings per share quickly will rapidly increase the 'E' in the equation. Therefore, even if you pay a high multiple of earnings now, that multiple will become lower in the future. Then, a lower P/E should attract more buyers, pushing the share price up.
It's great to see that City Union Bank grew EPS by 15% in the last year. And its annual EPS growth rate over 5 years is 11%. This could arguably justify a relatively high P/E ratio.
How Does City Union Bank's P/E Ratio Compare To Its Peers?
We can get an indication of market expectations by looking at the P/E ratio. The image below shows that City Union Bank has a P/E ratio that is roughly in line with the banks industry average (19.3).
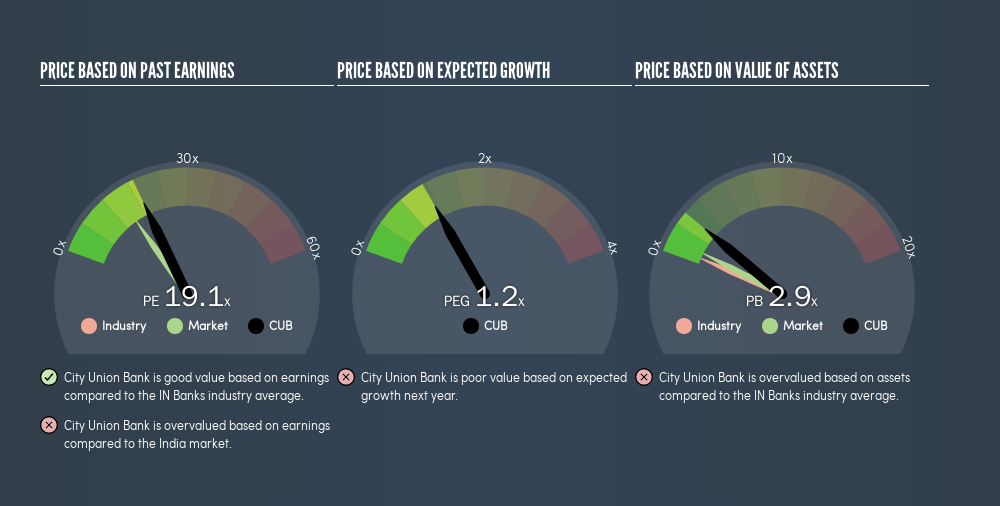
That indicates that the market expects City Union Bank will perform roughly in line with other companies in its industry. So if City Union Bank actually outperforms its peers going forward, that should be a positive for the share price. I inform my view byby checking management tenure and remuneration, among other things.
Don't Forget: The P/E Does Not Account For Debt or Bank Deposits
The 'Price' in P/E reflects the market capitalization of the company. That means it doesn't take debt or cash into account. Theoretically, a business can improve its earnings (and produce a lower P/E in the future), by taking on debt (or spending its remaining cash).
Such expenditure might be good or bad, in the long term, but the point here is that the balance sheet is not reflected by this ratio.
City Union Bank's Balance Sheet
City Union Bank has net cash of ₹6.6b. That should lead to a higher P/E than if it did have debt, because its strong balance sheets gives it more options.
The Verdict On City Union Bank's P/E Ratio
City Union Bank has a P/E of 19.1. That's higher than the average in the IN market, which is 15.1. Its strong balance sheet gives the company plenty of resources for extra growth, and it has already proven it can grow. Therefore it seems reasonable that the market would have relatively high expectations of the company
Investors have an opportunity when market expectations about a stock are wrong. If the reality for a company is better than it expects, you can make money by buying and holding for the long term. So this freereport on the analyst consensus forecasts could help you make a master move on this stock.
Of course you might be able to find a better stock than City Union Bank. So you may wish to see this freecollection of other companies that have grown earnings strongly.
We aim to bring you long-term focused research analysis driven by fundamental data. Note that our analysis may not factor in the latest price-sensitive company announcements or qualitative material.
If you spot an error that warrants correction, please contact the editor at editorial-team@simplywallst.com. This article by Simply Wall St is general in nature. It does not constitute a recommendation to buy or sell any stock, and does not take account of your objectives, or your financial situation. Simply Wall St has no position in the stocks mentioned. Thank you for reading.
About NSEI:CUB
City Union Bank
Engages in the provision of various banking products and services to personal and corporate clients in India.
Adequate balance sheet average dividend payer.
Similar Companies
Market Insights


Advertisement
Community Narratives
A case for TSXV:USA to reach USD $5.00 - $9.00 (CAD $7.30–$12.29) by 2029.
Fair Value CA$12.29|91.1% undervalued
AG
Community Contributor
DLocal's Future Growth Fueled by 35% Revenue and Profit Margin Boosts
Fair Value US$195.39|94.2% undervalued
WY
Community Contributor
Historically Cheap, but the Margin of Safety Is Still Thin
Fair Value SEK 232.58|13.2% undervalued
MA
Community Contributor