- India
- /
- Auto Components
- /
- NSEI:TIINDIA
Tube Investments of India's (NSE:TIINDIA) 71% CAGR outpaced the company's earnings growth over the same three-year period


For us, stock picking is in large part the hunt for the truly magnificent stocks. But when you hold the right stock for the right time period, the rewards can be truly huge. One bright shining star stock has been Tube Investments of India Limited (NSE:TIINDIA), which is 397% higher than three years ago. It's also up 30% in about a month.
Since it's been a strong week for Tube Investments of India shareholders, let's have a look at trend of the longer term fundamentals.
View our latest analysis for Tube Investments of India
There is no denying that markets are sometimes efficient, but prices do not always reflect underlying business performance. One flawed but reasonable way to assess how sentiment around a company has changed is to compare the earnings per share (EPS) with the share price.
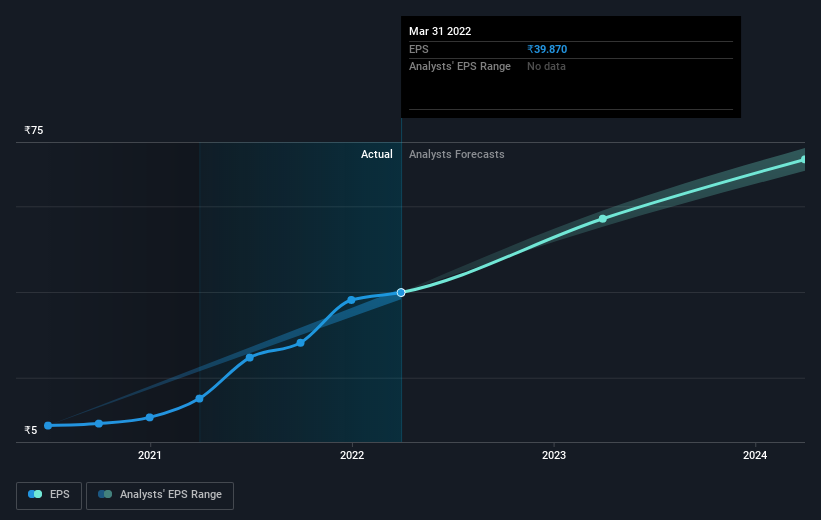
Tube Investments of India was able to grow its EPS at 46% per year over three years, sending the share price higher. This EPS growth is lower than the 71% average annual increase in the share price. This suggests that, as the business progressed over the last few years, it gained the confidence of market participants. That's not necessarily surprising considering the three-year track record of earnings growth. This optimism is also reflected in the fairly generous P/E ratio of 50.52.
You can see how EPS has changed over time in the image below (click on the chart to see the exact values).
It is of course excellent to see how Tube Investments of India has grown profits over the years, but the future is more important for shareholders. You can see how its balance sheet has strengthened (or weakened) over time in this free interactive graphic.
What About Dividends?
As well as measuring the share price return, investors should also consider the total shareholder return (TSR). Whereas the share price return only reflects the change in the share price, the TSR includes the value of dividends (assuming they were reinvested) and the benefit of any discounted capital raising or spin-off. So for companies that pay a generous dividend, the TSR is often a lot higher than the share price return. As it happens, Tube Investments of India's TSR for the last 3 years was 403%, which exceeds the share price return mentioned earlier. And there's no prize for guessing that the dividend payments largely explain the divergence!
A Different Perspective
Pleasingly, Tube Investments of India's total shareholder return last year was 85%. That's including the dividend. That's better than the annualized TSR of 71% over the last three years. Given the track record of solid returns over varying time frames, it might be worth putting Tube Investments of India on your watchlist. It's always interesting to track share price performance over the longer term. But to understand Tube Investments of India better, we need to consider many other factors. To that end, you should be aware of the 1 warning sign we've spotted with Tube Investments of India .
Of course, you might find a fantastic investment by looking elsewhere. So take a peek at this free list of companies we expect will grow earnings.
Please note, the market returns quoted in this article reflect the market weighted average returns of stocks that currently trade on IN exchanges.
Valuation is complex, but we're here to simplify it.
Discover if Tube Investments of India might be undervalued or overvalued with our detailed analysis, featuring fair value estimates, potential risks, dividends, insider trades, and its financial condition.
Access Free AnalysisHave feedback on this article? Concerned about the content? Get in touch with us directly. Alternatively, email editorial-team (at) simplywallst.com.
This article by Simply Wall St is general in nature. We provide commentary based on historical data and analyst forecasts only using an unbiased methodology and our articles are not intended to be financial advice. It does not constitute a recommendation to buy or sell any stock, and does not take account of your objectives, or your financial situation. We aim to bring you long-term focused analysis driven by fundamental data. Note that our analysis may not factor in the latest price-sensitive company announcements or qualitative material. Simply Wall St has no position in any stocks mentioned.
About NSEI:TIINDIA
Tube Investments of India
Engages in the manufacture and sale of precision engineered and metal formed products to automotive, railway, construction, agriculture, etc.
Flawless balance sheet with questionable track record.

