
Advertisement
A Look At The Fair Value Of Tata Motors Limited (NSE:TATAMTRDVR)
How far off is Tata Motors Limited (NSE:TATAMTRDVR) from its intrinsic value? Using the most recent financial data, we'll take a look at whether the stock is fairly priced by estimating the company's future cash flows and discounting them to their present value. The Discounted Cash Flow (DCF) model is the tool we will apply to do this. Don't get put off by the jargon, the math behind it is actually quite straightforward.
Companies can be valued in a lot of ways, so we would point out that a DCF is not perfect for every situation. If you still have some burning questions about this type of valuation, take a look at the Simply Wall St analysis model.
Check out our latest analysis for Tata Motors
The method
We are going to use a two-stage DCF model, which, as the name states, takes into account two stages of growth. The first stage is generally a higher growth period which levels off heading towards the terminal value, captured in the second 'steady growth' period. In the first stage we need to estimate the cash flows to the business over the next ten years. Where possible we use analyst estimates, but when these aren't available we extrapolate the previous free cash flow (FCF) from the last estimate or reported value. We assume companies with shrinking free cash flow will slow their rate of shrinkage, and that companies with growing free cash flow will see their growth rate slow, over this period. We do this to reflect that growth tends to slow more in the early years than it does in later years.
Generally we assume that a dollar today is more valuable than a dollar in the future, so we discount the value of these future cash flows to their estimated value in today's dollars:
10-year free cash flow (FCF) estimate
| 2021 | 2022 | 2023 | 2024 | 2025 | 2026 | 2027 | 2028 | 2029 | 2030 | |
| Levered FCF (₹, Millions) | ₹48.1b | ₹127.4b | ₹201.4b | ₹228.3b | ₹254.3b | ₹279.8b | ₹305.2b | ₹330.9b | ₹357.2b | ₹384.3b |
| Growth Rate Estimate Source | Analyst x15 | Analyst x15 | Analyst x14 | Est @ 13.36% | Est @ 11.4% | Est @ 10.04% | Est @ 9.08% | Est @ 8.41% | Est @ 7.94% | Est @ 7.61% |
| Present Value (₹, Millions) Discounted @ 21% | ₹39.9k | ₹87.7k | ₹115.0k | ₹108.1k | ₹99.9k | ₹91.2k | ₹82.6k | ₹74.2k | ₹66.5k | ₹59.3k |
("Est" = FCF growth rate estimated by Simply Wall St)
Present Value of 10-year Cash Flow (PVCF) = ₹825b
We now need to calculate the Terminal Value, which accounts for all the future cash flows after this ten year period. The Gordon Growth formula is used to calculate Terminal Value at a future annual growth rate equal to the 5-year average of the 10-year government bond yield of 6.8%. We discount the terminal cash flows to today's value at a cost of equity of 21%.
Terminal Value (TV)= FCF2030 × (1 + g) ÷ (r – g) = ₹384b× (1 + 6.8%) ÷ (21%– 6.8%) = ₹3.0t
Present Value of Terminal Value (PVTV)= TV / (1 + r)10= ₹3.0t÷ ( 1 + 21%)10= ₹463b
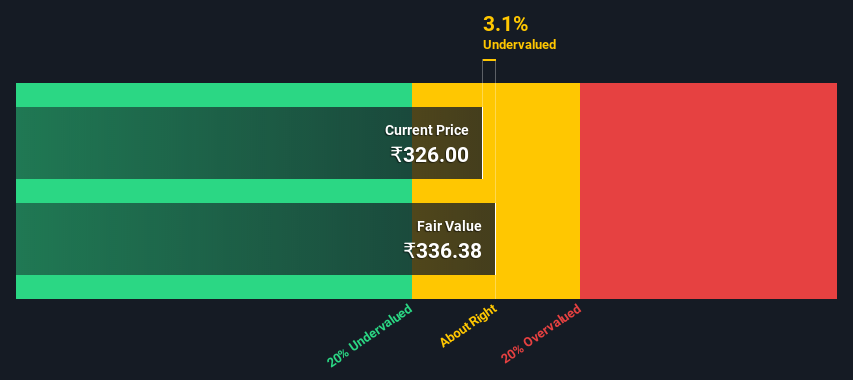
The total value, or equity value, is then the sum of the present value of the future cash flows, which in this case is ₹1.3t. The last step is to then divide the equity value by the number of shares outstanding. Relative to the current share price of ₹148, the company appears about fair value at a 3.1% discount to where the stock price trades currently. The assumptions in any calculation have a big impact on the valuation, so it is better to view this as a rough estimate, not precise down to the last cent.
Important assumptions
Now the most important inputs to a discounted cash flow are the discount rate, and of course, the actual cash flows. Part of investing is coming up with your own evaluation of a company's future performance, so try the calculation yourself and check your own assumptions. The DCF also does not consider the possible cyclicality of an industry, or a company's future capital requirements, so it does not give a full picture of a company's potential performance. Given that we are looking at Tata Motors as potential shareholders, the cost of equity is used as the discount rate, rather than the cost of capital (or weighted average cost of capital, WACC) which accounts for debt. In this calculation we've used 21%, which is based on a levered beta of 2.000. Beta is a measure of a stock's volatility, compared to the market as a whole. We get our beta from the industry average beta of globally comparable companies, with an imposed limit between 0.8 and 2.0, which is a reasonable range for a stable business.
Moving On:
Valuation is only one side of the coin in terms of building your investment thesis, and it is only one of many factors that you need to assess for a company. The DCF model is not a perfect stock valuation tool. Rather it should be seen as a guide to "what assumptions need to be true for this stock to be under/overvalued?" For example, changes in the company's cost of equity or the risk free rate can significantly impact the valuation. For Tata Motors, there are three relevant factors you should further examine:
- Risks: Every company has them, and we've spotted 1 warning sign for Tata Motors you should know about.
- Future Earnings: How does TATAMTRDVR's growth rate compare to its peers and the wider market? Dig deeper into the analyst consensus number for the upcoming years by interacting with our free analyst growth expectation chart.
- Other High Quality Alternatives: Do you like a good all-rounder? Explore our interactive list of high quality stocks to get an idea of what else is out there you may be missing!
PS. Simply Wall St updates its DCF calculation for every Indian stock every day, so if you want to find the intrinsic value of any other stock just search here.
If you’re looking to trade Tata Motors, open an account with the lowest-cost* platform trusted by professionals, Interactive Brokers. Their clients from over 200 countries and territories trade stocks, options, futures, forex, bonds and funds worldwide from a single integrated account. Promoted
Valuation is complex, but we're here to simplify it.
Discover if Tata Motors might be undervalued or overvalued with our detailed analysis, featuring fair value estimates, potential risks, dividends, insider trades, and its financial condition.
Access Free AnalysisThis article by Simply Wall St is general in nature. It does not constitute a recommendation to buy or sell any stock, and does not take account of your objectives, or your financial situation. We aim to bring you long-term focused analysis driven by fundamental data. Note that our analysis may not factor in the latest price-sensitive company announcements or qualitative material. Simply Wall St has no position in any stocks mentioned.
*Interactive Brokers Rated Lowest Cost Broker by StockBrokers.com Annual Online Review 2020
Have feedback on this article? Concerned about the content? Get in touch with us directly. Alternatively, email editorial-team (at) simplywallst.com.
About NSEI:TATAMTRDVR
Tata Motors
Designs, develops, manufactures, and sells various automotive vehicles.
Solid track record with adequate balance sheet and pays a dividend.
Similar Companies
Market Insights

Advertisement
Community Narratives
The company that turned a verb into a global necessity and basically runs the modern internet, digital ads, smartphones, maps, and AI.
Fair Value US$300.00|10.2% undervalued
OS
Community Contributor
Flowers Foods Pays A Fair Price For Health
Fair Value US$16.12|20.3% undervalued
NV
Community Contributor
TMX Group will thrive with 33.3% profit margin and enduring market moat
Fair Value CA$49.90|0.1% undervalued
LI
Community Contributor