
Advertisement
- India
- /
- Auto Components
- /
- NSEI:SUNDRMBRAK
Sundaram Brake Linings Limited's (NSE:SUNDRMBRAK) Stock is Soaring But Financials Seem Inconsistent: Will The Uptrend Continue?
Most readers would already be aware that Sundaram Brake Linings' (NSE:SUNDRMBRAK) stock increased significantly by 26% over the past three months. However, we wonder if the company's inconsistent financials would have any adverse impact on the current share price momentum. Particularly, we will be paying attention to Sundaram Brake Linings' ROE today.
Return on equity or ROE is an important factor to be considered by a shareholder because it tells them how effectively their capital is being reinvested. In other words, it is a profitability ratio which measures the rate of return on the capital provided by the company's shareholders.
View our latest analysis for Sundaram Brake Linings
How Is ROE Calculated?
The formula for return on equity is:
Return on Equity = Net Profit (from continuing operations) ÷ Shareholders' Equity
So, based on the above formula, the ROE for Sundaram Brake Linings is:
8.5% = ₹81m ÷ ₹951m (Based on the trailing twelve months to June 2024).
The 'return' is the yearly profit. That means that for every ₹1 worth of shareholders' equity, the company generated ₹0.09 in profit.
What Has ROE Got To Do With Earnings Growth?
So far, we've learned that ROE is a measure of a company's profitability. Depending on how much of these profits the company reinvests or "retains", and how effectively it does so, we are then able to assess a company’s earnings growth potential. Generally speaking, other things being equal, firms with a high return on equity and profit retention, have a higher growth rate than firms that don’t share these attributes.
Sundaram Brake Linings' Earnings Growth And 8.5% ROE
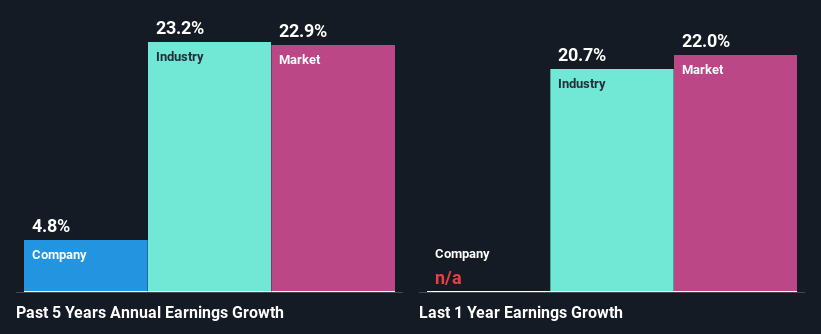
It is quite clear that Sundaram Brake Linings' ROE is rather low. Even compared to the average industry ROE of 12%, the company's ROE is quite dismal. Thus, the low net income growth of 4.8% seen by Sundaram Brake Linings over the past five years could probably be the result of it having a lower ROE.
Next, on comparing with the industry net income growth, we found that Sundaram Brake Linings' reported growth was lower than the industry growth of 23% over the last few years, which is not something we like to see.
Earnings growth is an important metric to consider when valuing a stock. What investors need to determine next is if the expected earnings growth, or the lack of it, is already built into the share price. This then helps them determine if the stock is placed for a bright or bleak future. One good indicator of expected earnings growth is the P/E ratio which determines the price the market is willing to pay for a stock based on its earnings prospects. So, you may want to check if Sundaram Brake Linings is trading on a high P/E or a low P/E, relative to its industry.
Is Sundaram Brake Linings Making Efficient Use Of Its Profits?
Sundaram Brake Linings' low three-year median payout ratio of 7.8% (or a retention ratio of 92%) should mean that the company is retaining most of its earnings to fuel its growth. However, the low earnings growth number doesn't reflect this as high growth usually follows high profit retention. Therefore, there might be some other reasons to explain the lack in that respect. For example, the business could be in decline.
Summary
On the whole, we feel that the performance shown by Sundaram Brake Linings can be open to many interpretations. Even though it appears to be retaining most of its profits, given the low ROE, investors may not be benefitting from all that reinvestment after all. The low earnings growth suggests our theory correct. Wrapping up, we would proceed with caution with this company and one way of doing that would be to look at the risk profile of the business. To know the 3 risks we have identified for Sundaram Brake Linings visit our risks dashboard for free.
New: Manage All Your Stock Portfolios in One Place
We've created the ultimate portfolio companion for stock investors, and it's free.
• Connect an unlimited number of Portfolios and see your total in one currency
• Be alerted to new Warning Signs or Risks via email or mobile
• Track the Fair Value of your stocks
Have feedback on this article? Concerned about the content? Get in touch with us directly. Alternatively, email editorial-team (at) simplywallst.com.
This article by Simply Wall St is general in nature. We provide commentary based on historical data and analyst forecasts only using an unbiased methodology and our articles are not intended to be financial advice. It does not constitute a recommendation to buy or sell any stock, and does not take account of your objectives, or your financial situation. We aim to bring you long-term focused analysis driven by fundamental data. Note that our analysis may not factor in the latest price-sensitive company announcements or qualitative material. Simply Wall St has no position in any stocks mentioned.
About NSEI:SUNDRMBRAK
Sundaram Brake Linings
Manufactures and sells asbestos free friction materials in India and internationally.
Mediocre balance sheet and slightly overvalued.
Similar Companies
Market Insights

Advertisement
Community Narratives
MINISO's fair value is projected at 26.69 with an anticipated PE ratio shift of 20x
Fair Value US$24.03|11.0% undervalued
BE
Community Contributor
Procter & Gamble: A Dividend Giant Facing Slowing Growth
Fair Value US$119.81|23.3% overvalued
AN
Community Contributor
Eli Lilly's Future Growth Driven by Tirzepatide and Favorable Market Conditions
Fair Value US$1.19k|13.8% undervalued
EA
Community Contributor