- India
- /
- Auto Components
- /
- NSEI:TVSHLTD
Interested In Sundaram-Clayton's (NSE:SUNCLAYLTD) Upcoming ₹15.00 Dividend? You Have One Day Left

Sundaram-Clayton Limited (NSE:SUNCLAYLTD) stock is about to trade ex-dividend in day or so. Investors can purchase shares before the 4th of February in order to be eligible for this dividend, which will be paid on the 28th of February.
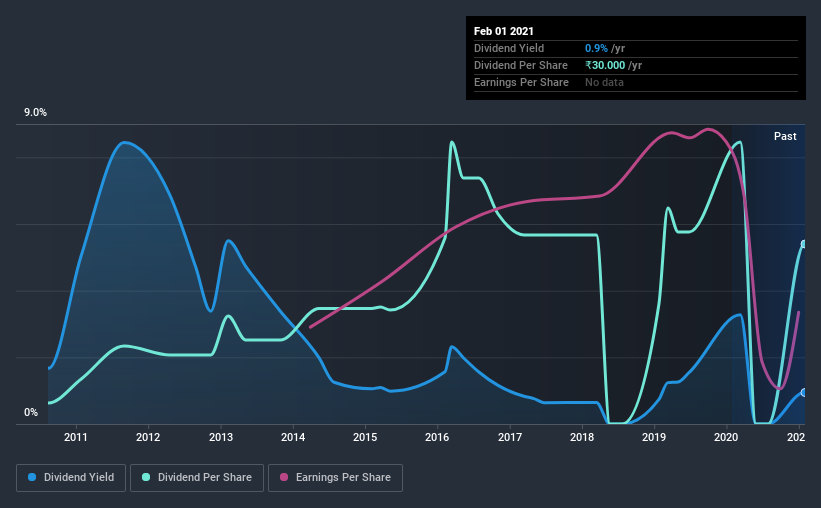
Sundaram-Clayton's next dividend payment will be ₹15.00 per share, on the back of last year when the company paid a total of ₹30.00 to shareholders. Calculating the last year's worth of payments shows that Sundaram-Clayton has a trailing yield of 0.9% on the current share price of ₹3617.7. Dividends are a major contributor to investment returns for long term holders, but only if the dividend continues to be paid. So we need to check whether the dividend payments are covered, and if earnings are growing.
Check out our latest analysis for Sundaram-Clayton
Dividends are usually paid out of company profits, so if a company pays out more than it earned then its dividend is usually at greater risk of being cut. Sundaram-Clayton is paying out just 18% of its profit after tax, which is comfortably low and leaves plenty of breathing room in the case of adverse events. Yet cash flow is typically more important than profit for assessing dividend sustainability, so we should always check if the company generated enough cash to afford its dividend. What's good is that dividends were well covered by free cash flow, with the company paying out 21% of its cash flow last year.
It's encouraging to see that the dividend is covered by both profit and cash flow. This generally suggests the dividend is sustainable, as long as earnings don't drop precipitously.
Click here to see how much of its profit Sundaram-Clayton paid out over the last 12 months.

Have Earnings And Dividends Been Growing?
Companies with falling earnings are riskier for dividend shareholders. If earnings decline and the company is forced to cut its dividend, investors could watch the value of their investment go up in smoke. So we're not too excited that Sundaram-Clayton's earnings are down 4.8% a year over the past five years.
Many investors will assess a company's dividend performance by evaluating how much the dividend payments have changed over time. Sundaram-Clayton has delivered 24% dividend growth per year on average over the past 10 years.
To Sum It Up
Has Sundaram-Clayton got what it takes to maintain its dividend payments? Sundaram-Clayton has comfortably low cash and profit payout ratios, which may mean the dividend is sustainable even in the face of a sharp decline in earnings per share. Still, we consider declining earnings to be a warning sign. All things considered, we are not particularly enthused about Sundaram-Clayton from a dividend perspective.
In light of that, while Sundaram-Clayton has an appealing dividend, it's worth knowing the risks involved with this stock. Every company has risks, and we've spotted 5 warning signs for Sundaram-Clayton (of which 2 are a bit unpleasant!) you should know about.
A common investment mistake is buying the first interesting stock you see. Here you can find a list of promising dividend stocks with a greater than 2% yield and an upcoming dividend.
When trading Sundaram-Clayton or any other investment, use the platform considered by many to be the Professional's Gateway to the Worlds Market, Interactive Brokers. You get the lowest-cost* trading on stocks, options, futures, forex, bonds and funds worldwide from a single integrated account. Promoted
Valuation is complex, but we're here to simplify it.
Discover if TVS Holdings might be undervalued or overvalued with our detailed analysis, featuring fair value estimates, potential risks, dividends, insider trades, and its financial condition.
Access Free AnalysisThis article by Simply Wall St is general in nature. It does not constitute a recommendation to buy or sell any stock, and does not take account of your objectives, or your financial situation. We aim to bring you long-term focused analysis driven by fundamental data. Note that our analysis may not factor in the latest price-sensitive company announcements or qualitative material. Simply Wall St has no position in any stocks mentioned.
*Interactive Brokers Rated Lowest Cost Broker by StockBrokers.com Annual Online Review 2020
Have feedback on this article? Concerned about the content? Get in touch with us directly. Alternatively, email editorial-team (at) simplywallst.com.
About NSEI:TVSHLTD
Solid track record, good value and pays a dividend.
Market Insights
Community Narratives


