
Howard Marks put it nicely when he said that, rather than worrying about share price volatility, 'The possibility of permanent loss is the risk I worry about... and every practical investor I know worries about.' It's only natural to consider a company's balance sheet when you examine how risky it is, since debt is often involved when a business collapses. We note that Sterling Tools Limited (NSE:STERTOOLS) does have debt on its balance sheet. But the real question is whether this debt is making the company risky.
When Is Debt Dangerous?
Generally speaking, debt only becomes a real problem when a company can't easily pay it off, either by raising capital or with its own cash flow. Part and parcel of capitalism is the process of 'creative destruction' where failed businesses are mercilessly liquidated by their bankers. However, a more common (but still painful) scenario is that it has to raise new equity capital at a low price, thus permanently diluting shareholders. By replacing dilution, though, debt can be an extremely good tool for businesses that need capital to invest in growth at high rates of return. When we examine debt levels, we first consider both cash and debt levels, together.
View our latest analysis for Sterling Tools
What Is Sterling Tools's Net Debt?
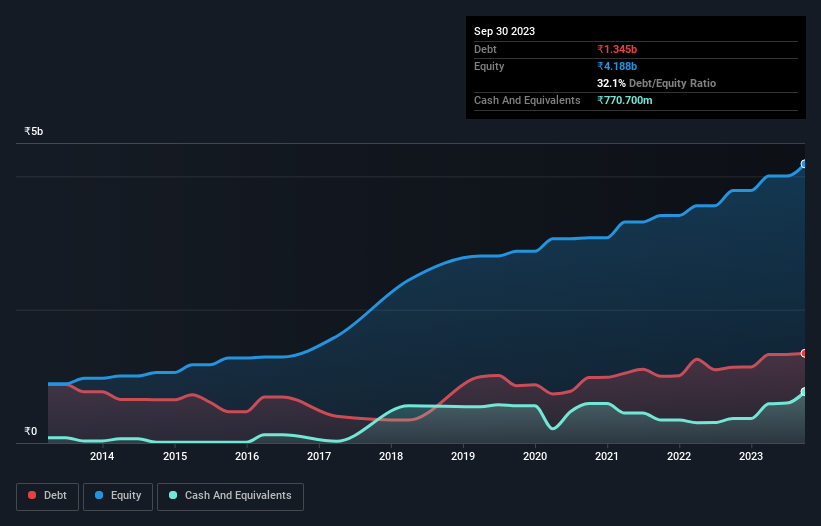
As you can see below, at the end of September 2023, Sterling Tools had ₹1.35b of debt, up from ₹1.14b a year ago. Click the image for more detail. However, because it has a cash reserve of ₹770.7m, its net debt is less, at about ₹574.8m.
A Look At Sterling Tools' Liabilities
The latest balance sheet data shows that Sterling Tools had liabilities of ₹1.91b due within a year, and liabilities of ₹647.5m falling due after that. Offsetting this, it had ₹770.7m in cash and ₹806.4m in receivables that were due within 12 months. So its liabilities outweigh the sum of its cash and (near-term) receivables by ₹976.4m.
Given Sterling Tools has a market capitalization of ₹13.8b, it's hard to believe these liabilities pose much threat. Having said that, it's clear that we should continue to monitor its balance sheet, lest it change for the worse.
We use two main ratios to inform us about debt levels relative to earnings. The first is net debt divided by earnings before interest, tax, depreciation, and amortization (EBITDA), while the second is how many times its earnings before interest and tax (EBIT) covers its interest expense (or its interest cover, for short). The advantage of this approach is that we take into account both the absolute quantum of debt (with net debt to EBITDA) and the actual interest expenses associated with that debt (with its interest cover ratio).
With net debt sitting at just 0.57 times EBITDA, Sterling Tools is arguably pretty conservatively geared. And this view is supported by the solid interest coverage, with EBIT coming in at 9.0 times the interest expense over the last year. On top of that, Sterling Tools grew its EBIT by 36% over the last twelve months, and that growth will make it easier to handle its debt. When analysing debt levels, the balance sheet is the obvious place to start. But it is future earnings, more than anything, that will determine Sterling Tools's ability to maintain a healthy balance sheet going forward. So if you're focused on the future you can check out this free report showing analyst profit forecasts.
Finally, a company can only pay off debt with cold hard cash, not accounting profits. So the logical step is to look at the proportion of that EBIT that is matched by actual free cash flow. Over the last three years, Sterling Tools reported free cash flow worth 14% of its EBIT, which is really quite low. For us, cash conversion that low sparks a little paranoia about is ability to extinguish debt.
Our View
Happily, Sterling Tools's impressive EBIT growth rate implies it has the upper hand on its debt. But, on a more sombre note, we are a little concerned by its conversion of EBIT to free cash flow. Taking all this data into account, it seems to us that Sterling Tools takes a pretty sensible approach to debt. That means they are taking on a bit more risk, in the hope of boosting shareholder returns. The balance sheet is clearly the area to focus on when you are analysing debt. But ultimately, every company can contain risks that exist outside of the balance sheet. For example, we've discovered 1 warning sign for Sterling Tools that you should be aware of before investing here.
At the end of the day, it's often better to focus on companies that are free from net debt. You can access our special list of such companies (all with a track record of profit growth). It's free.
The New Payments ETF Is Live on NASDAQ:
Money is moving to real-time rails, and a newly listed ETF now gives investors direct exposure. Fast settlement. Institutional custody. Simple access.
Explore how this launch could reshape portfolios
Sponsored ContentNew: Manage All Your Stock Portfolios in One Place
We've created the ultimate portfolio companion for stock investors, and it's free.
• Connect an unlimited number of Portfolios and see your total in one currency
• Be alerted to new Warning Signs or Risks via email or mobile
• Track the Fair Value of your stocks
Have feedback on this article? Concerned about the content? Get in touch with us directly. Alternatively, email editorial-team (at) simplywallst.com.
This article by Simply Wall St is general in nature. We provide commentary based on historical data and analyst forecasts only using an unbiased methodology and our articles are not intended to be financial advice. It does not constitute a recommendation to buy or sell any stock, and does not take account of your objectives, or your financial situation. We aim to bring you long-term focused analysis driven by fundamental data. Note that our analysis may not factor in the latest price-sensitive company announcements or qualitative material. Simply Wall St has no position in any stocks mentioned.
About NSEI:STERTOOLS
Sterling Tools
Manufactures and sells high tensile cold forged fasteners to original equipment manufacturers in India.
Flawless balance sheet, good value and pays a dividend.
Similar Companies
Market Insights

Weekly Picks

Early mover in a fast growing industry. Likely to experience share price volatility as they scale


A case for CA$31.80 (undiluted), aka 8,616% upside from CA$0.37 (an 86 bagger!).


Moderation and Stabilisation: HOLD: Fair Price based on a 4-year Cycle is $12.08
Recently Updated Narratives

Airbnb Stock: Platform Growth in a World of Saturation and Scrutiny

Adobe Stock: AI-Fueled ARR Growth Pushes Guidance Higher, But Cost Pressures Loom

Thomson Reuters Stock: When Legal Intelligence Becomes Mission-Critical Infrastructure
Popular Narratives


Crazy Undervalued 42 Baggers Silver Play (Active & Running Mine)


NVDA: Expanding AI Demand Will Drive Major Data Center Investments Through 2026

The AI Infrastructure Giant Grows Into Its Valuation
Trending Discussion


