
Advertisement
- India
- /
- Auto Components
- /
- NSEI:STERTOOLS
Is Sterling Tools Limited's (NSE:STERTOOLS) High P/E Ratio A Problem For Investors?
This article is for investors who would like to improve their understanding of price to earnings ratios (P/E ratios). To keep it practical, we'll show how Sterling Tools Limited's (NSE:STERTOOLS) P/E ratio could help you assess the value on offer. What is Sterling Tools's P/E ratio? Well, based on the last twelve months it is 24.65. That means that at current prices, buyers pay ₹24.65 for every ₹1 in trailing yearly profits.
View our latest analysis for Sterling Tools
How Do I Calculate A Price To Earnings Ratio?
The formula for price to earnings is:
Price to Earnings Ratio = Share Price ÷ Earnings per Share (EPS)
Or for Sterling Tools:
P/E of 24.65 = ₹215.00 ÷ ₹8.72 (Based on the trailing twelve months to September 2019.)
Is A High P/E Ratio Good?
A higher P/E ratio implies that investors pay a higher price for the earning power of the business. That isn't necessarily good or bad, but a high P/E implies relatively high expectations of what a company can achieve in the future.
How Does Sterling Tools's P/E Ratio Compare To Its Peers?
We can get an indication of market expectations by looking at the P/E ratio. You can see in the image below that the average P/E (15.7) for companies in the auto components industry is lower than Sterling Tools's P/E.
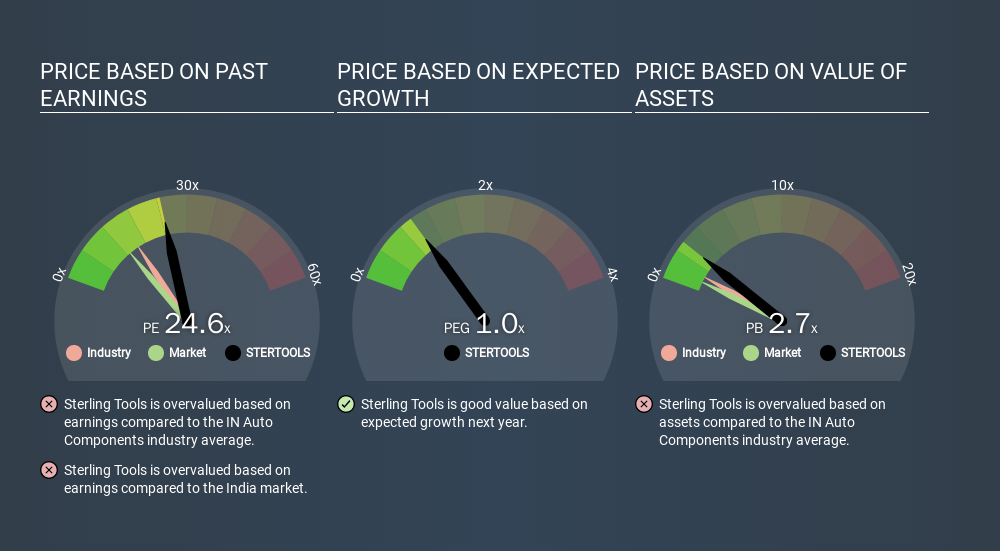
Its relatively high P/E ratio indicates that Sterling Tools shareholders think it will perform better than other companies in its industry classification. Shareholders are clearly optimistic, but the future is always uncertain. So further research is always essential. I often monitor director buying and selling.
How Growth Rates Impact P/E Ratios
Companies that shrink earnings per share quickly will rapidly decrease the 'E' in the equation. Therefore, even if you pay a low multiple of earnings now, that multiple will become higher in the future. A higher P/E should indicate the stock is expensive relative to others -- and that may encourage shareholders to sell.
Sterling Tools shrunk earnings per share by 34% over the last year. But it has grown its earnings per share by 12% per year over the last five years. And EPS is down 1.6% a year, over the last 3 years. This could justify a low P/E.
A Limitation: P/E Ratios Ignore Debt and Cash In The Bank
Don't forget that the P/E ratio considers market capitalization. Thus, the metric does not reflect cash or debt held by the company. The exact same company would hypothetically deserve a higher P/E ratio if it had a strong balance sheet, than if it had a weak one with lots of debt, because a cashed up company can spend on growth.
Spending on growth might be good or bad a few years later, but the point is that the P/E ratio does not account for the option (or lack thereof).
So What Does Sterling Tools's Balance Sheet Tell Us?
Net debt totals just 4.6% of Sterling Tools's market cap. It would probably trade on a higher P/E ratio if it had a lot of cash, but I doubt it is having a big impact.
The Bottom Line On Sterling Tools's P/E Ratio
Sterling Tools's P/E is 24.6 which is above average (13.0) in its market. With some debt but no EPS growth last year, the market has high expectations of future profits.
When the market is wrong about a stock, it gives savvy investors an opportunity. If the reality for a company is better than it expects, you can make money by buying and holding for the long term. So this free report on the analyst consensus forecasts could help you make a master move on this stock.
But note: Sterling Tools may not be the best stock to buy. So take a peek at this free list of interesting companies with strong recent earnings growth (and a P/E ratio below 20).
If you spot an error that warrants correction, please contact the editor at editorial-team@simplywallst.com. This article by Simply Wall St is general in nature. It does not constitute a recommendation to buy or sell any stock, and does not take account of your objectives, or your financial situation. Simply Wall St has no position in the stocks mentioned.
We aim to bring you long-term focused research analysis driven by fundamental data. Note that our analysis may not factor in the latest price-sensitive company announcements or qualitative material. Thank you for reading.
About NSEI:STERTOOLS
Sterling Tools
Manufactures and sells high tensile cold forged fasteners to original equipment manufacturers in India.
Flawless balance sheet, good value and pays a dividend.
Similar Companies
Market Insights

Advertisement
Community Narratives
MINISO's fair value is projected at 26.69 with an anticipated PE ratio shift of 20x
Fair Value US$24.03|9.0% undervalued
BE
Community Contributor
Procter & Gamble: A Dividend Giant Facing Slowing Growth
Fair Value US$119.81|23.5% overvalued
AN
Community Contributor
Eli Lilly's Future Growth Driven by Tirzepatide and Favorable Market Conditions
Fair Value US$1.19k|14.4% undervalued
EA
Community Contributor