
Advertisement
The external fund manager backed by Berkshire Hathaway's Charlie Munger, Li Lu, makes no bones about it when he says 'The biggest investment risk is not the volatility of prices, but whether you will suffer a permanent loss of capital.' So it might be obvious that you need to consider debt, when you think about how risky any given stock is, because too much debt can sink a company. We can see that G N A Axles Limited (NSE:GNA) does use debt in its business. But the real question is whether this debt is making the company risky.
What Risk Does Debt Bring?
Generally speaking, debt only becomes a real problem when a company can't easily pay it off, either by raising capital or with its own cash flow. If things get really bad, the lenders can take control of the business. However, a more usual (but still expensive) situation is where a company must dilute shareholders at a cheap share price simply to get debt under control. Of course, plenty of companies use debt to fund growth, without any negative consequences. The first thing to do when considering how much debt a business uses is to look at its cash and debt together.
Check out our latest analysis for G N A Axles
What Is G N A Axles's Debt?
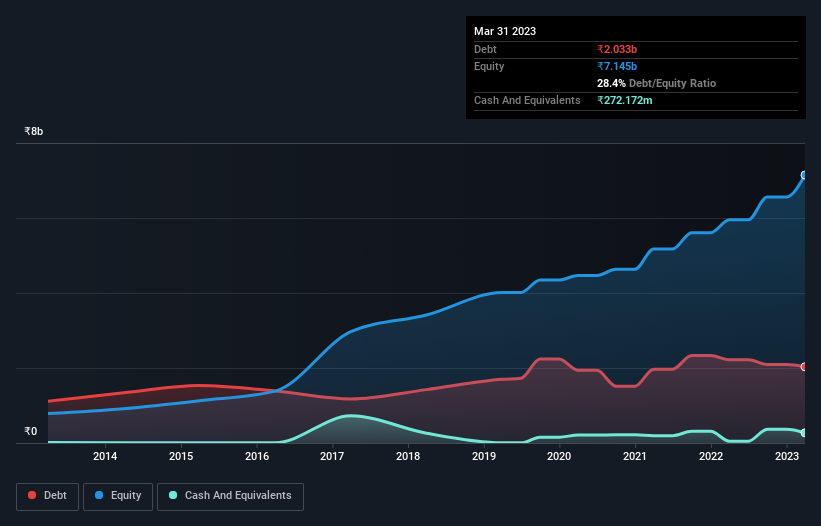
As you can see below, G N A Axles had ₹2.03b of debt at March 2023, down from ₹2.22b a year prior. However, because it has a cash reserve of ₹272.2m, its net debt is less, at about ₹1.76b.
A Look At G N A Axles' Liabilities
The latest balance sheet data shows that G N A Axles had liabilities of ₹4.26b due within a year, and liabilities of ₹300.6m falling due after that. On the other hand, it had cash of ₹272.2m and ₹5.61b worth of receivables due within a year. So it can boast ₹1.32b more liquid assets than total liabilities.
This short term liquidity is a sign that G N A Axles could probably pay off its debt with ease, as its balance sheet is far from stretched.
In order to size up a company's debt relative to its earnings, we calculate its net debt divided by its earnings before interest, tax, depreciation, and amortization (EBITDA) and its earnings before interest and tax (EBIT) divided by its interest expense (its interest cover). Thus we consider debt relative to earnings both with and without depreciation and amortization expenses.
G N A Axles has a low net debt to EBITDA ratio of only 0.76. And its EBIT covers its interest expense a whopping 16.8 times over. So we're pretty relaxed about its super-conservative use of debt. On top of that, G N A Axles grew its EBIT by 46% over the last twelve months, and that growth will make it easier to handle its debt. The balance sheet is clearly the area to focus on when you are analysing debt. But ultimately the future profitability of the business will decide if G N A Axles can strengthen its balance sheet over time. So if you're focused on the future you can check out this free report showing analyst profit forecasts.
But our final consideration is also important, because a company cannot pay debt with paper profits; it needs cold hard cash. So the logical step is to look at the proportion of that EBIT that is matched by actual free cash flow. In the last three years, G N A Axles created free cash flow amounting to 7.0% of its EBIT, an uninspiring performance. That limp level of cash conversion undermines its ability to manage and pay down debt.
Our View
G N A Axles's interest cover suggests it can handle its debt as easily as Cristiano Ronaldo could score a goal against an under 14's goalkeeper. But the stark truth is that we are concerned by its conversion of EBIT to free cash flow. Zooming out, G N A Axles seems to use debt quite reasonably; and that gets the nod from us. After all, sensible leverage can boost returns on equity. When analysing debt levels, the balance sheet is the obvious place to start. But ultimately, every company can contain risks that exist outside of the balance sheet. Case in point: We've spotted 1 warning sign for G N A Axles you should be aware of.
If you're interested in investing in businesses that can grow profits without the burden of debt, then check out this free list of growing businesses that have net cash on the balance sheet.
New: Manage All Your Stock Portfolios in One Place
We've created the ultimate portfolio companion for stock investors, and it's free.
• Connect an unlimited number of Portfolios and see your total in one currency
• Be alerted to new Warning Signs or Risks via email or mobile
• Track the Fair Value of your stocks
Have feedback on this article? Concerned about the content? Get in touch with us directly. Alternatively, email editorial-team (at) simplywallst.com.
This article by Simply Wall St is general in nature. We provide commentary based on historical data and analyst forecasts only using an unbiased methodology and our articles are not intended to be financial advice. It does not constitute a recommendation to buy or sell any stock, and does not take account of your objectives, or your financial situation. We aim to bring you long-term focused analysis driven by fundamental data. Note that our analysis may not factor in the latest price-sensitive company announcements or qualitative material. Simply Wall St has no position in any stocks mentioned.
About NSEI:GNA
G N A Axles
Manufactures and sells automotive transmission components for the four-wheeler industry in North America, South America, Europe, Asia, and Australia.
Flawless balance sheet with proven track record.
Similar Companies
Market Insights

Advertisement
Community Narratives
Finding The True Value Of A Logistics Powerhouse
Fair Value US$95.21|8.6% undervalued
NV
Community Contributor
Paradigm Biopharmaceuticals Will Lead Osteoarthritis Treatment with Zilosul's FDA Success
Fair Value AU$5.50|91.9% undervalued
AM
Community Contributor
Barrick Mining (ABX:CA): A Gold Hedge against a U.S. Shutdown
Fair Value CA$60.00|25.6% undervalued
GM
Community Contributor