
Advertisement
Did you know there are some financial metrics that can provide clues of a potential multi-bagger? One common approach is to try and find a company with returns on capital employed (ROCE) that are increasing, in conjunction with a growing amount of capital employed. Ultimately, this demonstrates that it's a business that is reinvesting profits at increasing rates of return. Having said that, from a first glance at ETGA Group (TLV:ETGA) we aren't jumping out of our chairs at how returns are trending, but let's have a deeper look.
What Is Return On Capital Employed (ROCE)?
If you haven't worked with ROCE before, it measures the 'return' (pre-tax profit) a company generates from capital employed in its business. The formula for this calculation on ETGA Group is:
Return on Capital Employed = Earnings Before Interest and Tax (EBIT) ÷ (Total Assets - Current Liabilities)
0.14 = ₪35m ÷ (₪488m - ₪231m) (Based on the trailing twelve months to September 2023).
So, ETGA Group has an ROCE of 14%. In absolute terms, that's a satisfactory return, but compared to the Logistics industry average of 7.4% it's much better.
See our latest analysis for ETGA Group
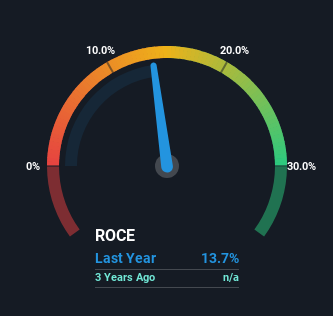
Historical performance is a great place to start when researching a stock so above you can see the gauge for ETGA Group's ROCE against it's prior returns. If you'd like to look at how ETGA Group has performed in the past in other metrics, you can view this free graph of ETGA Group's past earnings, revenue and cash flow.
What Can We Tell From ETGA Group's ROCE Trend?
There hasn't been much to report for ETGA Group's returns and its level of capital employed because both metrics have been steady for the past two years. Businesses with these traits tend to be mature and steady operations because they're past the growth phase. With that in mind, unless investment picks up again in the future, we wouldn't expect ETGA Group to be a multi-bagger going forward.
On a separate but related note, it's important to know that ETGA Group has a current liabilities to total assets ratio of 47%, which we'd consider pretty high. This effectively means that suppliers (or short-term creditors) are funding a large portion of the business, so just be aware that this can introduce some elements of risk. Ideally we'd like to see this reduce as that would mean fewer obligations bearing risks.
The Key Takeaway
In summary, ETGA Group isn't compounding its earnings but is generating stable returns on the same amount of capital employed. And in the last year, the stock has given away 30% so the market doesn't look too hopeful on these trends strengthening any time soon. Therefore based on the analysis done in this article, we don't think ETGA Group has the makings of a multi-bagger.
If you want to know some of the risks facing ETGA Group we've found 3 warning signs (1 doesn't sit too well with us!) that you should be aware of before investing here.
If you want to search for solid companies with great earnings, check out this free list of companies with good balance sheets and impressive returns on equity.
Valuation is complex, but we're here to simplify it.
Discover if ETGA Group might be undervalued or overvalued with our detailed analysis, featuring fair value estimates, potential risks, dividends, insider trades, and its financial condition.
Access Free AnalysisHave feedback on this article? Concerned about the content? Get in touch with us directly. Alternatively, email editorial-team (at) simplywallst.com.
This article by Simply Wall St is general in nature. We provide commentary based on historical data and analyst forecasts only using an unbiased methodology and our articles are not intended to be financial advice. It does not constitute a recommendation to buy or sell any stock, and does not take account of your objectives, or your financial situation. We aim to bring you long-term focused analysis driven by fundamental data. Note that our analysis may not factor in the latest price-sensitive company announcements or qualitative material. Simply Wall St has no position in any stocks mentioned.
About TASE:ETGA
Proven track record with mediocre balance sheet.
Market Insights

Advertisement
Community Narratives
MicroVision will explode future revenue by 380.37% with a vision towards success
Fair Value US$60|98.4% undervalued
TH
Community Contributor
The Indispensable Artery for a New North American Economy
Fair Value CA$132.87|0.7% overvalued
TI
Community Contributor
Recently Updated Narratives
NI

niteco on Texas Instruments ·
Engineered for Stability. Positioned for Growth.
Fair Value:US$314.4446.5% undervalued
1 followerusers have followed this narrative
0 commentsusers have commented on this narrative
0 likesusers have liked this narrative
BE


Bejgal on MINISO Group Holding ·
MINISO's fair value is projected at 26.69 with an anticipated PE ratio shift of 20x
Fair Value:US$28.1829.5% undervalued
46 followersusers have followed this narrative
3 commentsusers have commented on this narrative
0 likesusers have liked this narrative
BE

Bejgal on Fiverr International ·
Fiverr International will transform the freelance industry with AI-powered growth
Fair Value:US$36.8143.1% undervalued
79 followersusers have followed this narrative
7 commentsusers have commented on this narrative
0 likesusers have liked this narrative
Popular Narratives
TH

TheWallstreetKing on MicroVision ·
MicroVision will explode future revenue by 380.37% with a vision towards success
Fair Value:US$6098.4% undervalued
109 followersusers have followed this narrative
10 commentsusers have commented on this narrative
21 likesusers have liked this narrative
AN


AnalystConsensusTarget on NVIDIA ·
NVDA: Expanding AI Demand Will Drive Major Data Center Investments Through 2026
Fair Value:US$250.3929.3% undervalued
939 followersusers have followed this narrative
6 commentsusers have commented on this narrative
24 likesusers have liked this narrative
OS


oscargarcia on Alphabet ·
The company that turned a verb into a global necessity and basically runs the modern internet, digital ads, smartphones, maps, and AI.
Fair Value:US$3405.8% undervalued
145 followersusers have followed this narrative
6 commentsusers have commented on this narrative
18 likesusers have liked this narrative