
Advertisement
- Israel
- /
- Electronic Equipment and Components
- /
- TASE:TEDE
What Tedea Technological Development and Automation's (TLV:TEDE) Returns On Capital Can Tell Us
Ignoring the stock price of a company, what are the underlying trends that tell us a business is past the growth phase? When we see a declining return on capital employed (ROCE) in conjunction with a declining base of capital employed, that's often how a mature business shows signs of aging. This reveals that the company isn't compounding shareholder wealth because returns are falling and its net asset base is shrinking. On that note, looking into Tedea Technological Development and Automation (TLV:TEDE), we weren't too upbeat about how things were going.
Return On Capital Employed (ROCE): What is it?
If you haven't worked with ROCE before, it measures the 'return' (pre-tax profit) a company generates from capital employed in its business. The formula for this calculation on Tedea Technological Development and Automation is:
Return on Capital Employed = Earnings Before Interest and Tax (EBIT) ÷ (Total Assets - Current Liabilities)
0.014 = ₪952k ÷ (₪115m - ₪49m) (Based on the trailing twelve months to June 2020).
So, Tedea Technological Development and Automation has an ROCE of 1.4%. Ultimately, that's a low return and it under-performs the Electronic industry average of 12%.
Check out our latest analysis for Tedea Technological Development and Automation
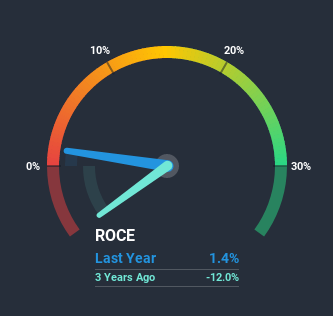
While the past is not representative of the future, it can be helpful to know how a company has performed historically, which is why we have this chart above. If you're interested in investigating Tedea Technological Development and Automation's past further, check out this free graph of past earnings, revenue and cash flow.
What Does the ROCE Trend For Tedea Technological Development and Automation Tell Us?
The trend of ROCE at Tedea Technological Development and Automation is showing some signs of weakness. The company used to generate 2.6% on its capital five years ago but it has since fallen noticeably. On top of that, the business is utilizing 47% less capital within its operations. The combination of lower ROCE and less capital employed can indicate that a business is likely to be facing some competitive headwinds or seeing an erosion to its moat. Typically businesses that exhibit these characteristics aren't the ones that tend to multiply over the long term, because statistically speaking, they've already gone through the growth phase of their life cycle.
On a side note, Tedea Technological Development and Automation's current liabilities have increased over the last five years to 42% of total assets, effectively distorting the ROCE to some degree. If current liabilities hadn't increased as much as they did, the ROCE could actually be even lower. And with current liabilities at these levels, suppliers or short-term creditors are effectively funding a large part of the business, which can introduce some risks.
What We Can Learn From Tedea Technological Development and Automation's ROCE
In summary, it's unfortunate that Tedea Technological Development and Automation is shrinking its capital base and also generating lower returns. The market must be rosy on the stock's future because even though the underlying trends aren't too encouraging, the stock has soared 138%. Regardless, we don't feel too comfortable with the fundamentals so we'd be steering clear of this stock for now.
One final note, you should learn about the 3 warning signs we've spotted with Tedea Technological Development and Automation (including 1 which shouldn't be ignored) .
While Tedea Technological Development and Automation isn't earning the highest return, check out this free list of companies that are earning high returns on equity with solid balance sheets.
If you decide to trade Tedea Technological Development and Automation, use the lowest-cost* platform that is rated #1 Overall by Barron’s, Interactive Brokers. Trade stocks, options, futures, forex, bonds and funds on 135 markets, all from a single integrated account. Promoted
Valuation is complex, but we're here to simplify it.
Discover if Tedea Technological Development and Automation might be undervalued or overvalued with our detailed analysis, featuring fair value estimates, potential risks, dividends, insider trades, and its financial condition.
Access Free AnalysisThis article by Simply Wall St is general in nature. It does not constitute a recommendation to buy or sell any stock, and does not take account of your objectives, or your financial situation. We aim to bring you long-term focused analysis driven by fundamental data. Note that our analysis may not factor in the latest price-sensitive company announcements or qualitative material. Simply Wall St has no position in any stocks mentioned.
*Interactive Brokers Rated Lowest Cost Broker by StockBrokers.com Annual Online Review 2020
Have feedback on this article? Concerned about the content? Get in touch with us directly. Alternatively, email editorial-team (at) simplywallst.com.
MI

The Foxhole
Nvidia's (NVDA) record profit had a US$7.8 billion catch. That chunk came from betting on its own customers, not from selling its chips.
116
JA

Jake_Merritt
The circularity worth examining is not the mark-to-market line. A large and growing share of Nvidia's revenue comes from companies funded by venture capital, and Nvidia participates in some of those rounds. That is the loop. The paper gains are just an accounting reflection of it, so focusing on them means arguing about the mirror rather than the room.
NA
nadia_y3d8i
Hyperscalers grew 13% sequentially, the other AI segment grew 25% and 138% year on year. The faster half is the funded half. AI venture funding was over 400 billion in the first half with about 70% spent on compute. That is an interesting composition shift like I mentioned yesterday.
 Mitchell Lawler
Market Insights
Which payment stocks actually get paid?

Every new payment app was supposed to kill Visa and Mastercard. Instead, they got bigger. So what does that mean for the payment stocks on your radar?
43
About TASE:TEDE
Tedea Technological Development and Automation
Through its subsidiaries, manufactures, imports, markets, and sells building products in Israel.
Moderate risk with worrying balance sheet.
Market Insights


Advertisement
Weekly Picks
RI


Rick_Orford on Starfighters Space ·
The 1960s Fighter Jet That Could Crack Open a $20 Billion Satellite Market
Fair Value:US$525.2% undervalued
72 followersusers have followed this narrative
4 commentsusers have commented on this narrative
12 likesusers have liked this narrative
TR


tripledub on Meta Platforms ·
The $135 Billion Bet That Should Make Every Shareholder Nervous
Fair Value:US$5862.5% undervalued
57 followersusers have followed this narrative
3 commentsusers have commented on this narrative
34 likesusers have liked this narrative
TA


Talos on Voyager Technologies ·
The "Landlord of Orbit" – A Deep Value Play Ahead of the Starlab Era
Fair Value:US$385.291.0% undervalued
54 followersusers have followed this narrative
0 commentsusers have commented on this narrative
6 likesusers have liked this narrative
IV

Ivoed on Uber Technologies ·
Uber’s Valuation Depends On Who Captures The Economics Of Driverless Rides
Fair Value:US$11633.7% undervalued
12 followersusers have followed this narrative
0 commentsusers have commented on this narrative
3 likesusers have liked this narrative
Recently Updated Narratives
PA

Pad on Williamson Tea Kenya ·
Long Term Hold
Fair Value:KSh18616.0% undervalued
16 followersusers have followed this narrative
0 commentsusers have commented on this narrative
0 likesusers have liked this narrative
TR


TripleS on Domo ·
$4.84 in cash & $900 million of NOLs available in November.
Fair Value:US$851.1% undervalued
1 followerusers have followed this narrative
0 commentsusers have commented on this narrative
0 likesusers have liked this narrative
LU


LunaRodas on Malibu Boats ·
MBUU | Malibu Boats: What They Said vs. What They Did
Fair Value:US$33.514.0% undervalued
1 followerusers have followed this narrative
0 commentsusers have commented on this narrative
0 likesusers have liked this narrative
Popular Narratives
OS


oscargarcia on NVIDIA ·
The company that went from selling GPUs to gamers to becoming the AI arms dealer of the 21st century.
Fair Value:US$28018.6% undervalued
365 followersusers have followed this narrative
9 commentsusers have commented on this narrative
16 likesusers have liked this narrative
CU

CubanEros on Microsoft ·
A wonderful business at reasonable price.
Fair Value:US$419.9120.2% overvalued
212 followersusers have followed this narrative
0 commentsusers have commented on this narrative
9 likesusers have liked this narrative
KI

KiwiInvest on Amazon.com ·
Amazon's high growth, high tech segments propel its profits, while traditional segments plod along
Fair Value:US$475.0946.1% undervalued
236 followersusers have followed this narrative
1 commentusers have commented on this narrative
8 likesusers have liked this narrative


