
Advertisement
- Israel
- /
- Electronic Equipment and Components
- /
- TASE:TEDE
These 4 Measures Indicate That Tedea Technological Development and Automation (TLV:TEDE) Is Using Debt Extensively
Howard Marks put it nicely when he said that, rather than worrying about share price volatility, 'The possibility of permanent loss is the risk I worry about... and every practical investor I know worries about.' When we think about how risky a company is, we always like to look at its use of debt, since debt overload can lead to ruin. Importantly, Tedea Technological Development and Automation Ltd. (TLV:TEDE) does carry debt. But is this debt a concern to shareholders?
When Is Debt A Problem?
Debt and other liabilities become risky for a business when it cannot easily fulfill those obligations, either with free cash flow or by raising capital at an attractive price. In the worst case scenario, a company can go bankrupt if it cannot pay its creditors. However, a more frequent (but still costly) occurrence is where a company must issue shares at bargain-basement prices, permanently diluting shareholders, just to shore up its balance sheet. Of course, debt can be an important tool in businesses, particularly capital heavy businesses. When we examine debt levels, we first consider both cash and debt levels, together.
Check out the opportunities and risks within the IL Electronic industry.
What Is Tedea Technological Development and Automation's Debt?
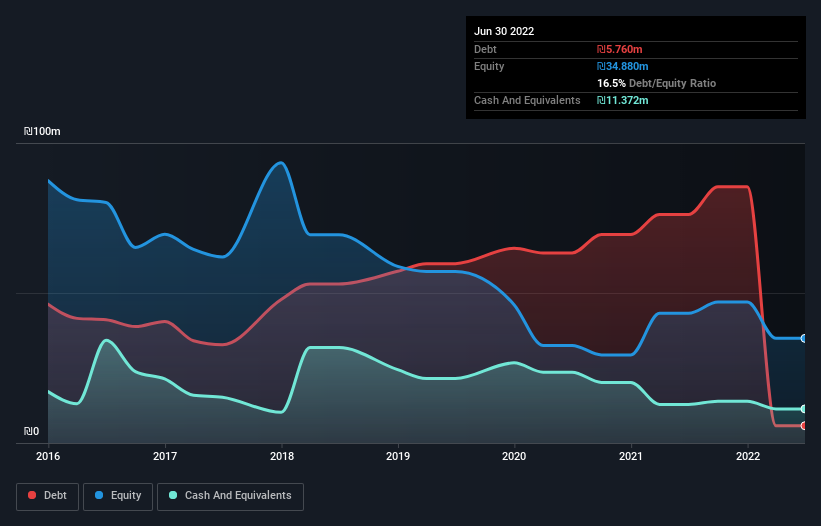
As you can see below, Tedea Technological Development and Automation had ₪5.76m of debt at June 2022, down from ₪76.1m a year prior. But it also has ₪11.4m in cash to offset that, meaning it has ₪5.61m net cash.
How Strong Is Tedea Technological Development and Automation's Balance Sheet?
According to the last reported balance sheet, Tedea Technological Development and Automation had liabilities of ₪140.0m due within 12 months, and liabilities of ₪6.76m due beyond 12 months. On the other hand, it had cash of ₪11.4m and ₪202.0k worth of receivables due within a year. So its liabilities outweigh the sum of its cash and (near-term) receivables by ₪135.2m.
When you consider that this deficiency exceeds the company's ₪90.2m market capitalization, you might well be inclined to review the balance sheet intently. In the scenario where the company had to clean up its balance sheet quickly, it seems likely shareholders would suffer extensive dilution. Tedea Technological Development and Automation boasts net cash, so it's fair to say it does not have a heavy debt load, even if it does have very significant liabilities, in total.
Although Tedea Technological Development and Automation made a loss at the EBIT level, last year, it was also good to see that it generated ₪23m in EBIT over the last twelve months. The balance sheet is clearly the area to focus on when you are analysing debt. But it is Tedea Technological Development and Automation's earnings that will influence how the balance sheet holds up in the future. So when considering debt, it's definitely worth looking at the earnings trend. Click here for an interactive snapshot.
Finally, a company can only pay off debt with cold hard cash, not accounting profits. Tedea Technological Development and Automation may have net cash on the balance sheet, but it is still interesting to look at how well the business converts its earnings before interest and tax (EBIT) to free cash flow, because that will influence both its need for, and its capacity to manage debt. During the last year, Tedea Technological Development and Automation burned a lot of cash. While investors are no doubt expecting a reversal of that situation in due course, it clearly does mean its use of debt is more risky.
Summing Up
While Tedea Technological Development and Automation does have more liabilities than liquid assets, it also has net cash of ₪5.61m. Despite its cash we think that Tedea Technological Development and Automation seems to struggle to convert EBIT to free cash flow, so we are wary of the stock. When analysing debt levels, the balance sheet is the obvious place to start. But ultimately, every company can contain risks that exist outside of the balance sheet. These risks can be hard to spot. Every company has them, and we've spotted 3 warning signs for Tedea Technological Development and Automation (of which 1 doesn't sit too well with us!) you should know about.
At the end of the day, it's often better to focus on companies that are free from net debt. You can access our special list of such companies (all with a track record of profit growth). It's free.
Valuation is complex, but we're here to simplify it.
Discover if Tedea Technological Development and Automation might be undervalued or overvalued with our detailed analysis, featuring fair value estimates, potential risks, dividends, insider trades, and its financial condition.
Access Free AnalysisHave feedback on this article? Concerned about the content? Get in touch with us directly. Alternatively, email editorial-team (at) simplywallst.com.
This article by Simply Wall St is general in nature. We provide commentary based on historical data and analyst forecasts only using an unbiased methodology and our articles are not intended to be financial advice. It does not constitute a recommendation to buy or sell any stock, and does not take account of your objectives, or your financial situation. We aim to bring you long-term focused analysis driven by fundamental data. Note that our analysis may not factor in the latest price-sensitive company announcements or qualitative material. Simply Wall St has no position in any stocks mentioned.
MI

The Foxhole
A landmark settlement is meant to punish Meta (META). If the 1998 tobacco deal is any guide, it might protect it.
189
ZO
zoe_vi5fn
Any moat with an opt-out clause for your competitors is just a fence around your own garden.
CO
connor_iwn1g
Worth looking at what previous legal action actually did to Meta rather than reaching for tobacco. The FTC's record five billion dollar privacy fine in 2019 was met with the stock rising, because it came in below fears and removed an open question. GDPR was designed to constrain large platforms and increased their share of the European ad market, because compliance cost fell hardest on small intermediaries. The FTC's antitrust case, the one that could genuinely have broken the company up, was decided in Meta's favour last November. The only thing that ever meaningfully hurt the business was Apple changing a tracking default, and Meta out-spent that too, while the ad-tech firms that could not afford to rebuild disappeared. The pattern is not that Meta survives regulation. It is that regulation keeps costing its smaller competitors more.
 Andrew Legget
Market Insights
Great earnings season, but are the earnings real?

At first glance, this was the strongest earnings season in years. But when you look at where the growth actually came from, the story splits into two very different pictures.
10
About TASE:TEDE
Tedea Technological Development and Automation
Through its subsidiaries, manufactures, imports, markets, and sells building products in Israel.
Slight risk with worrying balance sheet.
Market Insights


Advertisement
Weekly Picks
LO


Lou_Basenese on Oncolytics Biotech ·
The Team Behind a $2 Billion Johnson & Johnson (JNJ) Deal Just Took Over This $105 Million Cancer Biotech
Fair Value:US$3.575.5% undervalued
36 followersusers have followed this narrative
0 commentsusers have commented on this narrative
11 likesusers have liked this narrative
TR


tripledub on Meta Platforms ·
The $135 Billion Bet That Should Make Every Shareholder Nervous
Fair Value:US$5861.4% undervalued
62 followersusers have followed this narrative
3 commentsusers have commented on this narrative
34 likesusers have liked this narrative
TA


Talos on Voyager Technologies ·
The "Landlord of Orbit" – A Deep Value Play Ahead of the Starlab Era
Fair Value:US$385.291.1% undervalued
66 followersusers have followed this narrative
0 commentsusers have commented on this narrative
6 likesusers have liked this narrative
IV

Ivoed on Uber Technologies ·
Uber’s Valuation Depends On Who Captures The Economics Of Driverless Rides
Fair Value:US$11632.1% undervalued
13 followersusers have followed this narrative
0 commentsusers have commented on this narrative
3 likesusers have liked this narrative
Recently Updated Narratives
ST


StjepanK on Radisson Mining Resources ·
Radisson Mining Is A Clear Multibagger Junior M&A Story
Fair Value:CA$782.7% undervalued
1 followerusers have followed this narrative
0 commentsusers have commented on this narrative
0 likesusers have liked this narrative
AN

andre_santos on Meta Platforms ·
Meta - A Fundamental and Historical Valuation
Fair Value:US$842.6731.4% undervalued
3 followersusers have followed this narrative
0 commentsusers have commented on this narrative
0 likesusers have liked this narrative
AL

Alex_bert on Rezolve AI ·
What's behind the counter for RZLV AI
Fair Value:US$2.6810.8% overvalued
1 followerusers have followed this narrative
0 commentsusers have commented on this narrative
0 likesusers have liked this narrative
Popular Narratives
OS


oscargarcia on NVIDIA ·
The company that went from selling GPUs to gamers to becoming the AI arms dealer of the 21st century.
Fair Value:US$28022.3% undervalued
363 followersusers have followed this narrative
9 commentsusers have commented on this narrative
16 likesusers have liked this narrative
CU

CubanEros on Microsoft ·
A wonderful business at reasonable price.
Fair Value:US$419.9122.3% overvalued
210 followersusers have followed this narrative
0 commentsusers have commented on this narrative
9 likesusers have liked this narrative
JO


John_Eric on MercadoLibre ·
MercadoLibre and the Spreadsheet Trick That Decides Everything
Fair Value:US$7.31k73.1% undervalued
125 followersusers have followed this narrative
3 commentsusers have commented on this narrative
17 likesusers have liked this narrative
Trending Discussion
MA

max_profit on Happiest Minds Technologies ·
sold all my happiest mind , if the owner doesn't want to stick around why would i
0
|0


JE

jean_pierre_lan_dsslz on Mauritius Development Investment Trust ·
Yes, MDIT is simply just a Deposit-long term stock with a good Dividend, no more, no less. It has just declared a Dividend of 0.11 cs payable 21 September 2026. Its price fluctuates between 1.90cs & 2.00cs. No capital gain in the short or medium term.
0
|0