
Advertisement
- Israel
- /
- Electronic Equipment and Components
- /
- TASE:ICON
Has iCon Group Ltd's (TLV:ICON) Impressive Stock Performance Got Anything to Do With Its Fundamentals?
Most readers would already be aware that iCon Group's (TLV:ICON) stock increased significantly by 36% over the past three months. Given that stock prices are usually aligned with a company's financial performance in the long-term, we decided to study its financial indicators more closely to see if they had a hand to play in the recent price move. Particularly, we will be paying attention to iCon Group's ROE today.
ROE or return on equity is a useful tool to assess how effectively a company can generate returns on the investment it received from its shareholders. In simpler terms, it measures the profitability of a company in relation to shareholder's equity.
How Do You Calculate Return On Equity?
ROE can be calculated by using the formula:
Return on Equity = Net Profit (from continuing operations) ÷ Shareholders' Equity
So, based on the above formula, the ROE for iCon Group is:
12% = ₪33m ÷ ₪269m (Based on the trailing twelve months to March 2025).
The 'return' is the amount earned after tax over the last twelve months. That means that for every ₪1 worth of shareholders' equity, the company generated ₪0.12 in profit.
View our latest analysis for iCon Group
What Is The Relationship Between ROE And Earnings Growth?
We have already established that ROE serves as an efficient profit-generating gauge for a company's future earnings. Depending on how much of these profits the company reinvests or "retains", and how effectively it does so, we are then able to assess a company’s earnings growth potential. Assuming all else is equal, companies that have both a higher return on equity and higher profit retention are usually the ones that have a higher growth rate when compared to companies that don't have the same features.
iCon Group's Earnings Growth And 12% ROE
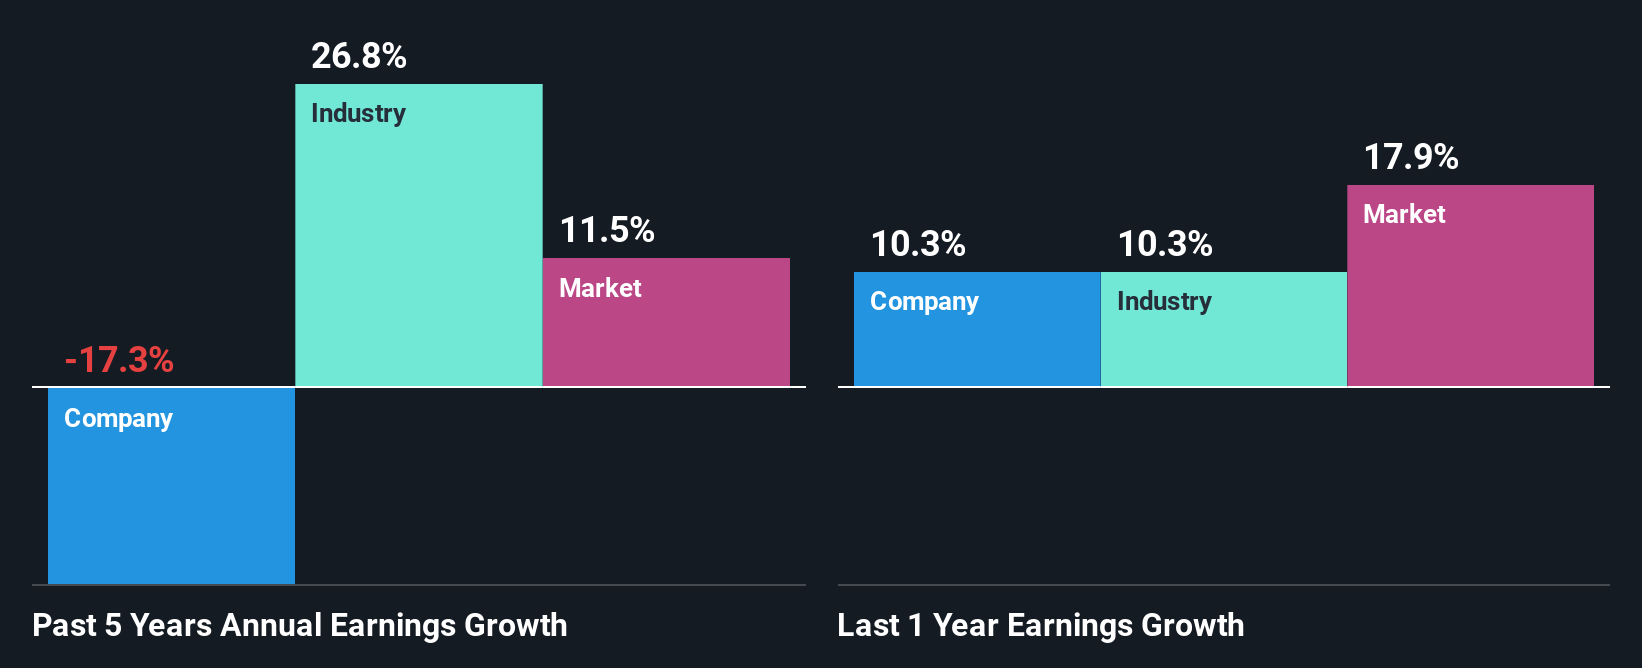
To start with, iCon Group's ROE looks acceptable. Even so, when compared with the average industry ROE of 16%, we aren't very excited. Needless to say, the 17% net income shrink rate seen by iCon Groupover the past five years is a huge dampener. Not to forget, the company does have a high ROE to begin with, just that it is lower than the industry average. Hence there might be some other aspects that are causing earnings to shrink. For example, it could be that the company has a high payout ratio or the business has allocated capital poorly, for instance.
However, when we compared iCon Group's growth with the industry we found that while the company's earnings have been shrinking, the industry has seen an earnings growth of 27% in the same period. This is quite worrisome.
Earnings growth is a huge factor in stock valuation. What investors need to determine next is if the expected earnings growth, or the lack of it, is already built into the share price. By doing so, they will have an idea if the stock is headed into clear blue waters or if swampy waters await. One good indicator of expected earnings growth is the P/E ratio which determines the price the market is willing to pay for a stock based on its earnings prospects. So, you may want to check if iCon Group is trading on a high P/E or a low P/E, relative to its industry.
Is iCon Group Efficiently Re-investing Its Profits?
While the company did payout a portion of its dividend in the past, it currently doesn't pay a regular dividend. This implies that potentially all of its profits are being reinvested in the business.
Summary
On the whole, we do feel that iCon Group has some positive attributes. However, while the company does have a decent ROE and a high profit retention, its earnings growth number is quite disappointing. This suggests that there might be some external threat to the business, that's hampering growth. While we won't completely dismiss the company, what we would do, is try to ascertain how risky the business is to make a more informed decision around the company. You can see the 2 risks we have identified for iCon Group by visiting our risks dashboard for free on our platform here.
Valuation is complex, but we're here to simplify it.
Discover if iCon Group might be undervalued or overvalued with our detailed analysis, featuring fair value estimates, potential risks, dividends, insider trades, and its financial condition.
Access Free AnalysisHave feedback on this article? Concerned about the content? Get in touch with us directly. Alternatively, email editorial-team (at) simplywallst.com.
This article by Simply Wall St is general in nature. We provide commentary based on historical data and analyst forecasts only using an unbiased methodology and our articles are not intended to be financial advice. It does not constitute a recommendation to buy or sell any stock, and does not take account of your objectives, or your financial situation. We aim to bring you long-term focused analysis driven by fundamental data. Note that our analysis may not factor in the latest price-sensitive company announcements or qualitative material. Simply Wall St has no position in any stocks mentioned.
About TASE:ICON
iCon Group
Engages in importing and distributing Apple products in Israel.
Flawless balance sheet and good value.
Market Insights

Advertisement
Community Narratives
MINISO's fair value is projected at 26.69 with an anticipated PE ratio shift of 20x
Fair Value US$24.03|11.0% undervalued
BE
Community Contributor
Procter & Gamble: A Dividend Giant Facing Slowing Growth
Fair Value US$119.81|23.3% overvalued
AN
Community Contributor
Eli Lilly's Future Growth Driven by Tirzepatide and Favorable Market Conditions
Fair Value US$1.19k|13.8% undervalued
EA
Community Contributor