
Advertisement
Bubbles Intergroup Ltd's (TLV:BBLS) Shares Leap 25% Yet They're Still Not Telling The Full Story
Bubbles Intergroup Ltd (TLV:BBLS) shareholders would be excited to see that the share price has had a great month, posting a 25% gain and recovering from prior weakness. Notwithstanding the latest gain, the annual share price return of 6.6% isn't as impressive.
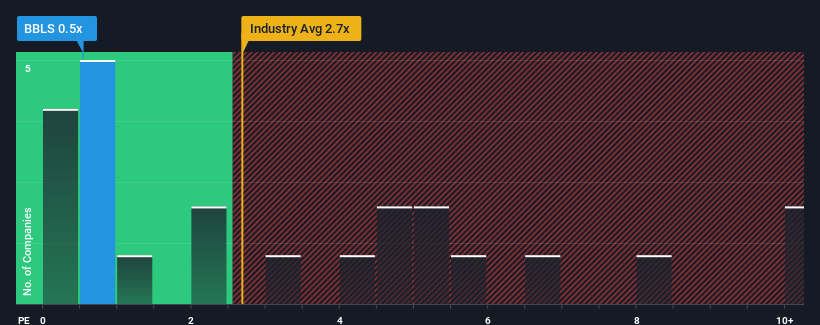
In spite of the firm bounce in price, Bubbles Intergroup's price-to-sales (or "P/S") ratio of 0.5x might still make it look like a strong buy right now compared to the wider Software industry in Israel, where around half of the companies have P/S ratios above 3.9x and even P/S above 6x are quite common. Although, it's not wise to just take the P/S at face value as there may be an explanation why it's so limited.
See our latest analysis for Bubbles Intergroup
How Has Bubbles Intergroup Performed Recently?
For example, consider that Bubbles Intergroup's financial performance has been pretty ordinary lately as revenue growth is non-existent. One possibility is that the P/S is low because investors think this benign revenue growth rate will likely underperform the broader industry in the near future. If you like the company, you'd be hoping this isn't the case so that you could potentially pick up some stock while it's out of favour.
We don't have analyst forecasts, but you can see how recent trends are setting up the company for the future by checking out our free report on Bubbles Intergroup's earnings, revenue and cash flow.What Are Revenue Growth Metrics Telling Us About The Low P/S?
In order to justify its P/S ratio, Bubbles Intergroup would need to produce anemic growth that's substantially trailing the industry.
If we review the last year of revenue, the company posted a result that saw barely any deviation from a year ago. Still, the latest three year period has seen an excellent 106% overall rise in revenue, in spite of its uninspiring short-term performance. So while the company has done a solid job in the past, it's somewhat concerning to see revenue growth decline as much as it has.
Comparing that recent medium-term revenue trajectory with the industry's one-year growth forecast of 21% shows it's noticeably more attractive.
With this information, we find it odd that Bubbles Intergroup is trading at a P/S lower than the industry. Apparently some shareholders believe the recent performance has exceeded its limits and have been accepting significantly lower selling prices.
The Bottom Line On Bubbles Intergroup's P/S
Bubbles Intergroup's recent share price jump still sees fails to bring its P/S alongside the industry median. Using the price-to-sales ratio alone to determine if you should sell your stock isn't sensible, however it can be a practical guide to the company's future prospects.
We're very surprised to see Bubbles Intergroup currently trading on a much lower than expected P/S since its recent three-year growth is higher than the wider industry forecast. When we see strong revenue with faster-than-industry growth, we assume there are some significant underlying risks to the company's ability to make money which is applying downwards pressure on the P/S ratio. It appears many are indeed anticipating revenue instability, because the persistence of these recent medium-term conditions would normally provide a boost to the share price.
It's always necessary to consider the ever-present spectre of investment risk. We've identified 2 warning signs with Bubbles Intergroup, and understanding these should be part of your investment process.
If strong companies turning a profit tickle your fancy, then you'll want to check out this free list of interesting companies that trade on a low P/E (but have proven they can grow earnings).
Valuation is complex, but we're here to simplify it.
Discover if Bubbles Intergroup might be undervalued or overvalued with our detailed analysis, featuring fair value estimates, potential risks, dividends, insider trades, and its financial condition.
Access Free AnalysisHave feedback on this article? Concerned about the content? Get in touch with us directly. Alternatively, email editorial-team (at) simplywallst.com.
This article by Simply Wall St is general in nature. We provide commentary based on historical data and analyst forecasts only using an unbiased methodology and our articles are not intended to be financial advice. It does not constitute a recommendation to buy or sell any stock, and does not take account of your objectives, or your financial situation. We aim to bring you long-term focused analysis driven by fundamental data. Note that our analysis may not factor in the latest price-sensitive company announcements or qualitative material. Simply Wall St has no position in any stocks mentioned.
Have feedback on this article? Concerned about the content? Get in touch with us directly. Alternatively, email editorial-team@simplywallst.com
About TASE:BBLS
Bubbles Intergroup
Engages in the production, purchasing, importing, marketing, and distribution of children clothing products.
Adequate balance sheet with slight risk.
Market Insights

Advertisement
Community Narratives
MicroVision will explode future revenue by 380.37% with a vision towards success
Fair Value US$60|98.4% undervalued
TH
Community Contributor
The Indispensable Artery for a New North American Economy
Fair Value CA$132.87|1.6% undervalued
TI
Community Contributor
Recently Updated Narratives
BE


Bejgal on MINISO Group Holding ·
MINISO's fair value is projected at 26.69 with an anticipated PE ratio shift of 20x
Fair Value:US$26.6928.0% undervalued
44 followersusers have followed this narrative
3 commentsusers have commented on this narrative
0 likesusers have liked this narrative
TI


TickerTickle on Oracle ·
The Quiet Giant That Became AI’s Power Grid
Fair Value:US$389.8149.5% undervalued
7 followersusers have followed this narrative
1 commentusers have commented on this narrative
0 likesusers have liked this narrative
AU

AuCA on Nova Ljubljanska Banka d.d ·
Nova Ljubljanska Banka d.d will expect a 11.2% revenue boost driving future growth
Fair Value:€20916.5% undervalued
23 followersusers have followed this narrative
3 commentsusers have commented on this narrative
0 likesusers have liked this narrative
Popular Narratives
OS


oscargarcia on Alphabet ·
The company that turned a verb into a global necessity and basically runs the modern internet, digital ads, smartphones, maps, and AI.
Fair Value:US$3404.9% undervalued
136 followersusers have followed this narrative
6 commentsusers have commented on this narrative
18 likesusers have liked this narrative
TH

TheWallstreetKing on MicroVision ·
MicroVision will explode future revenue by 380.37% with a vision towards success
Fair Value:US$6098.4% undervalued
87 followersusers have followed this narrative
11 commentsusers have commented on this narrative
18 likesusers have liked this narrative
AN


AnalystConsensusTarget on NVIDIA ·
NVDA: Expanding AI Demand Will Drive Major Data Center Investments Through 2026
Fair Value:US$232.7923.6% undervalued
925 followersusers have followed this narrative
6 commentsusers have commented on this narrative
22 likesusers have liked this narrative