
Advertisement
N.R. Spuntech Industries Ltd. (TLV:SPNTC) Stock Catapults 28% Though Its Price And Business Still Lag The Industry
N.R. Spuntech Industries Ltd. (TLV:SPNTC) shareholders would be excited to see that the share price has had a great month, posting a 28% gain and recovering from prior weakness. Looking further back, the 19% rise over the last twelve months isn't too bad notwithstanding the strength over the last 30 days.
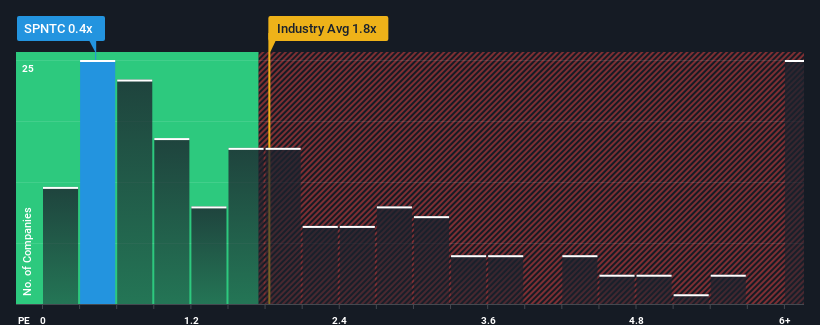
Although its price has surged higher, N.R. Spuntech Industries' price-to-sales (or "P/S") ratio of 0.4x might still make it look like a buy right now compared to the Personal Products industry in Israel, where around half of the companies have P/S ratios above 1.8x and even P/S above 4x are quite common. However, the P/S might be low for a reason and it requires further investigation to determine if it's justified.
View our latest analysis for N.R. Spuntech Industries
What Does N.R. Spuntech Industries' P/S Mean For Shareholders?
Revenue has risen at a steady rate over the last year for N.R. Spuntech Industries, which is generally not a bad outcome. It might be that many expect the respectable revenue performance to degrade, which has repressed the P/S. If you like the company, you'd be hoping this isn't the case so that you could potentially pick up some stock while it's out of favour.
Want the full picture on earnings, revenue and cash flow for the company? Then our free report on N.R. Spuntech Industries will help you shine a light on its historical performance.Do Revenue Forecasts Match The Low P/S Ratio?
N.R. Spuntech Industries' P/S ratio would be typical for a company that's only expected to deliver limited growth, and importantly, perform worse than the industry.
Retrospectively, the last year delivered a decent 6.6% gain to the company's revenues. Although, the latest three year period in total hasn't been as good as it didn't manage to provide any growth at all. Therefore, it's fair to say that revenue growth has been inconsistent recently for the company.
Comparing that to the industry, which is predicted to deliver 9.6% growth in the next 12 months, the company's momentum is weaker, based on recent medium-term annualised revenue results.
With this information, we can see why N.R. Spuntech Industries is trading at a P/S lower than the industry. It seems most investors are expecting to see the recent limited growth rates continue into the future and are only willing to pay a reduced amount for the stock.
The Bottom Line On N.R. Spuntech Industries' P/S
The latest share price surge wasn't enough to lift N.R. Spuntech Industries' P/S close to the industry median. Typically, we'd caution against reading too much into price-to-sales ratios when settling on investment decisions, though it can reveal plenty about what other market participants think about the company.
As we suspected, our examination of N.R. Spuntech Industries revealed its three-year revenue trends are contributing to its low P/S, given they look worse than current industry expectations. Right now shareholders are accepting the low P/S as they concede future revenue probably won't provide any pleasant surprises. Unless the recent medium-term conditions improve, they will continue to form a barrier for the share price around these levels.
Don't forget that there may be other risks. For instance, we've identified 4 warning signs for N.R. Spuntech Industries (2 are concerning) you should be aware of.
Of course, profitable companies with a history of great earnings growth are generally safer bets. So you may wish to see this free collection of other companies that have reasonable P/E ratios and have grown earnings strongly.
Valuation is complex, but we're here to simplify it.
Discover if N.R. Spuntech Industries might be undervalued or overvalued with our detailed analysis, featuring fair value estimates, potential risks, dividends, insider trades, and its financial condition.
Access Free AnalysisHave feedback on this article? Concerned about the content? Get in touch with us directly. Alternatively, email editorial-team (at) simplywallst.com.
This article by Simply Wall St is general in nature. We provide commentary based on historical data and analyst forecasts only using an unbiased methodology and our articles are not intended to be financial advice. It does not constitute a recommendation to buy or sell any stock, and does not take account of your objectives, or your financial situation. We aim to bring you long-term focused analysis driven by fundamental data. Note that our analysis may not factor in the latest price-sensitive company announcements or qualitative material. Simply Wall St has no position in any stocks mentioned.
About TASE:SPNTC
N.R. Spuntech Industries
Produces, markets, and sells non-woven fabrics in Israel, the United States, Canada, Europe, Central and Southern America, and internationally.
Average dividend payer with slight risk.
Similar Companies
Market Insights

Advertisement
Community Narratives
MINISO's fair value is projected at 26.69 with an anticipated PE ratio shift of 20x
Fair Value US$24.03|12.0% undervalued
BE
Community Contributor
Procter & Gamble: A Dividend Giant Facing Slowing Growth
Fair Value US$119.81|21.7% overvalued
AN
Community Contributor
Eli Lilly's Future Growth Driven by Tirzepatide and Favorable Market Conditions
Fair Value US$1.19k|14.1% undervalued
EA
Community Contributor