Stock Analysis
- Israel
- /
- Household Products
- /
- TASE:SANO1
Sano Bruno's Enterprises' (TLV:SANO1) five-year earnings growth trails the 15% YoY shareholder returns


Generally speaking the aim of active stock picking is to find companies that provide returns that are superior to the market average. And while active stock picking involves risks (and requires diversification) it can also provide excess returns. For example, the Sano Bruno's Enterprises Ltd (TLV:SANO1) share price is up 84% in the last 5 years, clearly besting the market return of around 20% (ignoring dividends). However, more recent returns haven't been as impressive as that, with the stock returning just 59% in the last year, including dividends.
Since the stock has added ₪338m to its market cap in the past week alone, let's see if underlying performance has been driving long-term returns.
View our latest analysis for Sano Bruno's Enterprises
While markets are a powerful pricing mechanism, share prices reflect investor sentiment, not just underlying business performance. One flawed but reasonable way to assess how sentiment around a company has changed is to compare the earnings per share (EPS) with the share price.
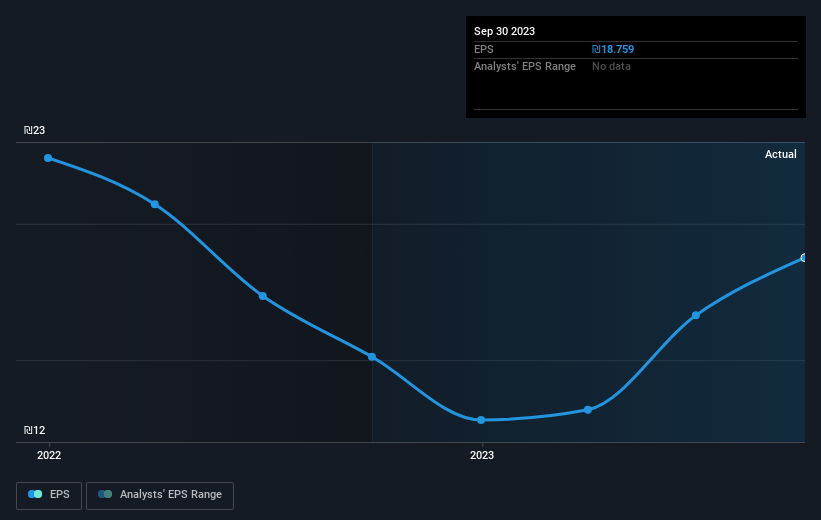
Over half a decade, Sano Bruno's Enterprises managed to grow its earnings per share at 6.8% a year. This EPS growth is slower than the share price growth of 13% per year, over the same period. This suggests that market participants hold the company in higher regard, these days. That's not necessarily surprising considering the five-year track record of earnings growth.
You can see below how EPS has changed over time (discover the exact values by clicking on the image).
We're pleased to report that the CEO is remunerated more modestly than most CEOs at similarly capitalized companies. But while CEO remuneration is always worth checking, the really important question is whether the company can grow earnings going forward. Dive deeper into the earnings by checking this interactive graph of Sano Bruno's Enterprises' earnings, revenue and cash flow.
What About Dividends?
As well as measuring the share price return, investors should also consider the total shareholder return (TSR). Whereas the share price return only reflects the change in the share price, the TSR includes the value of dividends (assuming they were reinvested) and the benefit of any discounted capital raising or spin-off. It's fair to say that the TSR gives a more complete picture for stocks that pay a dividend. As it happens, Sano Bruno's Enterprises' TSR for the last 5 years was 103%, which exceeds the share price return mentioned earlier. The dividends paid by the company have thusly boosted the total shareholder return.
A Different Perspective
It's good to see that Sano Bruno's Enterprises has rewarded shareholders with a total shareholder return of 59% in the last twelve months. And that does include the dividend. That's better than the annualised return of 15% over half a decade, implying that the company is doing better recently. Someone with an optimistic perspective could view the recent improvement in TSR as indicating that the business itself is getting better with time. Before forming an opinion on Sano Bruno's Enterprises you might want to consider these 3 valuation metrics.
If you like to buy stocks alongside management, then you might just love this free list of companies. (Hint: many of them are unnoticed AND have attractive valuation).
Please note, the market returns quoted in this article reflect the market weighted average returns of stocks that currently trade on Israeli exchanges.
Valuation is complex, but we're helping make it simple.
Find out whether Sano Bruno's Enterprises is potentially over or undervalued by checking out our comprehensive analysis, which includes fair value estimates, risks and warnings, dividends, insider transactions and financial health.
View the Free AnalysisHave feedback on this article? Concerned about the content? Get in touch with us directly. Alternatively, email editorial-team (at) simplywallst.com.
This article by Simply Wall St is general in nature. We provide commentary based on historical data and analyst forecasts only using an unbiased methodology and our articles are not intended to be financial advice. It does not constitute a recommendation to buy or sell any stock, and does not take account of your objectives, or your financial situation. We aim to bring you long-term focused analysis driven by fundamental data. Note that our analysis may not factor in the latest price-sensitive company announcements or qualitative material. Simply Wall St has no position in any stocks mentioned.
About TASE:SANO1
Sano Bruno's Enterprises
Manufactures and sells laundry products, home care products, cleaning and hygiene products, kitchen accessories, air fresheners, insecticides, and paper products worldwide.
Flawless balance sheet with solid track record.
