- Israel
- /
- Consumer Finance
- /
- TASE:DIFI
A Piece Of The Puzzle Missing From Direct Finance of Direct Group (2006)Ltd's (TLV:DIFI) Share Price

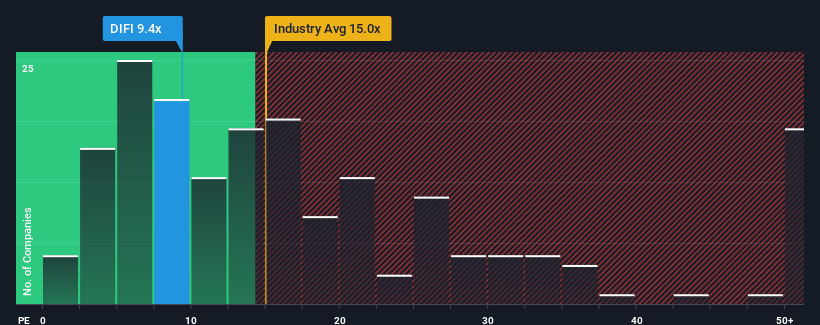
Direct Finance of Direct Group (2006)Ltd's (TLV:DIFI) price-to-earnings (or "P/E") ratio of 9.4x might make it look like a buy right now compared to the market in Israel, where around half of the companies have P/E ratios above 13x and even P/E's above 21x are quite common. Although, it's not wise to just take the P/E at face value as there may be an explanation why it's limited.
As an illustration, earnings have deteriorated at Direct Finance of Direct Group (2006)Ltd over the last year, which is not ideal at all. One possibility is that the P/E is low because investors think the company won't do enough to avoid underperforming the broader market in the near future. However, if this doesn't eventuate then existing shareholders may be feeling optimistic about the future direction of the share price.
See our latest analysis for Direct Finance of Direct Group (2006)Ltd
How Is Direct Finance of Direct Group (2006)Ltd's Growth Trending?
Direct Finance of Direct Group (2006)Ltd's P/E ratio would be typical for a company that's only expected to deliver limited growth, and importantly, perform worse than the market.
Taking a look back first, the company's earnings per share growth last year wasn't something to get excited about as it posted a disappointing decline of 31%. However, a few very strong years before that means that it was still able to grow EPS by an impressive 130% in total over the last three years. Although it's been a bumpy ride, it's still fair to say the earnings growth recently has been more than adequate for the company.
This is in contrast to the rest of the market, which is expected to grow by 17% over the next year, materially lower than the company's recent medium-term annualised growth rates.
With this information, we find it odd that Direct Finance of Direct Group (2006)Ltd is trading at a P/E lower than the market. It looks like most investors are not convinced the company can maintain its recent growth rates.
The Bottom Line On Direct Finance of Direct Group (2006)Ltd's P/E
It's argued the price-to-earnings ratio is an inferior measure of value within certain industries, but it can be a powerful business sentiment indicator.
Our examination of Direct Finance of Direct Group (2006)Ltd revealed its three-year earnings trends aren't contributing to its P/E anywhere near as much as we would have predicted, given they look better than current market expectations. When we see strong earnings with faster-than-market growth, we assume potential risks are what might be placing significant pressure on the P/E ratio. At least price risks look to be very low if recent medium-term earnings trends continue, but investors seem to think future earnings could see a lot of volatility.
Before you take the next step, you should know about the 3 warning signs for Direct Finance of Direct Group (2006)Ltd (1 makes us a bit uncomfortable!) that we have uncovered.
It's important to make sure you look for a great company, not just the first idea you come across. So take a peek at this free list of interesting companies with strong recent earnings growth (and a low P/E).
The New Payments ETF Is Live on NASDAQ:
Money is moving to real-time rails, and a newly listed ETF now gives investors direct exposure. Fast settlement. Institutional custody. Simple access.
Explore how this launch could reshape portfolios
Sponsored ContentNew: Manage All Your Stock Portfolios in One Place
We've created the ultimate portfolio companion for stock investors, and it's free.
• Connect an unlimited number of Portfolios and see your total in one currency
• Be alerted to new Warning Signs or Risks via email or mobile
• Track the Fair Value of your stocks
Have feedback on this article? Concerned about the content? Get in touch with us directly. Alternatively, email editorial-team (at) simplywallst.com.
This article by Simply Wall St is general in nature. We provide commentary based on historical data and analyst forecasts only using an unbiased methodology and our articles are not intended to be financial advice. It does not constitute a recommendation to buy or sell any stock, and does not take account of your objectives, or your financial situation. We aim to bring you long-term focused analysis driven by fundamental data. Note that our analysis may not factor in the latest price-sensitive company announcements or qualitative material. Simply Wall St has no position in any stocks mentioned.
About TASE:DIFI
Direct Finance of Direct Group (2006)Ltd
Direct Finance of Direct Group (2006) Ltd provides consumer credit for vehicles, loans against vehicle liens, loans for various business.
Proven track record with low risk.
Market Insights

Weekly Picks

Early mover in a fast growing industry. Likely to experience share price volatility as they scale


A case for CA$31.80 (undiluted), aka 8,616% upside from CA$0.37 (an 86 bagger!).


Moderation and Stabilisation: HOLD: Fair Price based on a 4-year Cycle is $12.08
Recently Updated Narratives

Airbnb Stock: Platform Growth in a World of Saturation and Scrutiny

Adobe Stock: AI-Fueled ARR Growth Pushes Guidance Higher, But Cost Pressures Loom

Thomson Reuters Stock: When Legal Intelligence Becomes Mission-Critical Infrastructure
Popular Narratives


Crazy Undervalued 42 Baggers Silver Play (Active & Running Mine)


NVDA: Expanding AI Demand Will Drive Major Data Center Investments Through 2026

The AI Infrastructure Giant Grows Into Its Valuation
Trending Discussion


