- Israel
- /
- Consumer Finance
- /
- TASE:DIFI
Earnings Not Telling The Story For Direct Finance of Direct Group (2006) Ltd (TLV:DIFI)
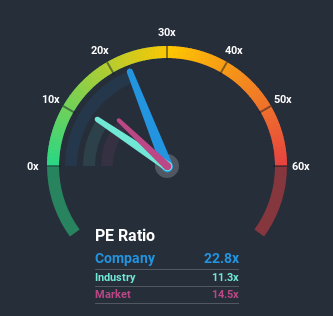
With a price-to-earnings (or "P/E") ratio of 22.8x Direct Finance of Direct Group (2006) Ltd (TLV:DIFI) may be sending very bearish signals at the moment, given that almost half of all companies in Israel have P/E ratios under 14x and even P/E's lower than 8x are not unusual. Nonetheless, we'd need to dig a little deeper to determine if there is a rational basis for the highly elevated P/E.
For example, consider that Direct Finance of Direct Group (2006)'s financial performance has been poor lately as it's earnings have been in decline. One possibility is that the P/E is high because investors think the company will still do enough to outperform the broader market in the near future. You'd really hope so, otherwise you're paying a pretty hefty price for no particular reason.
Check out our latest analysis for Direct Finance of Direct Group (2006)

Does Growth Match The High P/E?
There's an inherent assumption that a company should far outperform the market for P/E ratios like Direct Finance of Direct Group (2006)'s to be considered reasonable.
Retrospectively, the last year delivered a frustrating 55% decrease to the company's bottom line. The last three years don't look nice either as the company has shrunk EPS by 6.9% in aggregate. So unfortunately, we have to acknowledge that the company has not done a great job of growing earnings over that time.
In contrast to the company, the rest of the market is expected to grow by 31% over the next year, which really puts the company's recent medium-term earnings decline into perspective.
With this information, we find it concerning that Direct Finance of Direct Group (2006) is trading at a P/E higher than the market. It seems most investors are ignoring the recent poor growth rate and are hoping for a turnaround in the company's business prospects. Only the boldest would assume these prices are sustainable as a continuation of recent earnings trends is likely to weigh heavily on the share price eventually.
The Key Takeaway
While the price-to-earnings ratio shouldn't be the defining factor in whether you buy a stock or not, it's quite a capable barometer of earnings expectations.
Our examination of Direct Finance of Direct Group (2006) revealed its shrinking earnings over the medium-term aren't impacting its high P/E anywhere near as much as we would have predicted, given the market is set to grow. Right now we are increasingly uncomfortable with the high P/E as this earnings performance is highly unlikely to support such positive sentiment for long. If recent medium-term earnings trends continue, it will place shareholders' investments at significant risk and potential investors in danger of paying an excessive premium.
There are also other vital risk factors to consider and we've discovered 3 warning signs for Direct Finance of Direct Group (2006) (2 make us uncomfortable!) that you should be aware of before investing here.
If you're unsure about the strength of Direct Finance of Direct Group (2006)'s business, why not explore our interactive list of stocks with solid business fundamentals for some other companies you may have missed.
If you decide to trade Direct Finance of Direct Group (2006), use the lowest-cost* platform that is rated #1 Overall by Barron’s, Interactive Brokers. Trade stocks, options, futures, forex, bonds and funds on 135 markets, all from a single integrated account. Promoted
New: Manage All Your Stock Portfolios in One Place
We've created the ultimate portfolio companion for stock investors, and it's free.
• Connect an unlimited number of Portfolios and see your total in one currency
• Be alerted to new Warning Signs or Risks via email or mobile
• Track the Fair Value of your stocks
This article by Simply Wall St is general in nature. It does not constitute a recommendation to buy or sell any stock, and does not take account of your objectives, or your financial situation. We aim to bring you long-term focused analysis driven by fundamental data. Note that our analysis may not factor in the latest price-sensitive company announcements or qualitative material. Simply Wall St has no position in any stocks mentioned.
*Interactive Brokers Rated Lowest Cost Broker by StockBrokers.com Annual Online Review 2020
Have feedback on this article? Concerned about the content? Get in touch with us directly. Alternatively, email editorial-team@simplywallst.com.
About TASE:DIFI
Direct Finance of Direct Group (2006)Ltd
Direct Finance of Direct Group (2006) Ltd provides consumer credit for vehicles, loans against vehicle liens, loans for various business.
Proven track record with low risk.
Market Insights
Community Narratives


Recently Updated Narratives


Engineered for Stability. Positioned for Growth.


MINISO's fair value is projected at 26.69 with an anticipated PE ratio shift of 20x


Fiverr International will transform the freelance industry with AI-powered growth
Popular Narratives


MicroVision will explode future revenue by 380.37% with a vision towards success


NVDA: Expanding AI Demand Will Drive Major Data Center Investments Through 2026


