- Israel
- /
- Capital Markets
- /
- TASE:ANLT
Subdued Growth No Barrier To Analyst I.M.S. Investment Management Services Ltd's (TLV:ANLT) Price
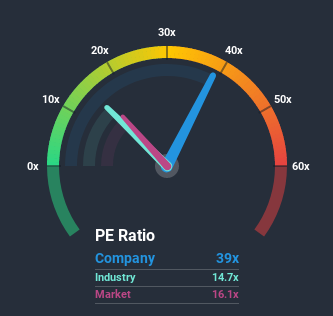
Analyst I.M.S. Investment Management Services Ltd's (TLV:ANLT) price-to-earnings (or "P/E") ratio of 39x might make it look like a strong sell right now compared to the market in Israel, where around half of the companies have P/E ratios below 16x and even P/E's below 10x are quite common. Although, it's not wise to just take the P/E at face value as there may be an explanation why it's so lofty.
As an illustration, earnings have deteriorated at Analyst I.M.S. Investment Management Services over the last year, which is not ideal at all. It might be that many expect the company to still outplay most other companies over the coming period, which has kept the P/E from collapsing. You'd really hope so, otherwise you're paying a pretty hefty price for no particular reason.
Check out our latest analysis for Analyst I.M.S. Investment Management Services

Is There Enough Growth For Analyst I.M.S. Investment Management Services?
Analyst I.M.S. Investment Management Services' P/E ratio would be typical for a company that's expected to deliver very strong growth, and importantly, perform much better than the market.
Retrospectively, the last year delivered a frustrating 70% decrease to the company's bottom line. As a result, earnings from three years ago have also fallen 19% overall. Therefore, it's fair to say the earnings growth recently has been undesirable for the company.
In contrast to the company, the rest of the market is expected to grow by 63% over the next year, which really puts the company's recent medium-term earnings decline into perspective.
With this information, we find it concerning that Analyst I.M.S. Investment Management Services is trading at a P/E higher than the market. It seems most investors are ignoring the recent poor growth rate and are hoping for a turnaround in the company's business prospects. There's a very good chance existing shareholders are setting themselves up for future disappointment if the P/E falls to levels more in line with the recent negative growth rates.
The Bottom Line On Analyst I.M.S. Investment Management Services' P/E
Generally, our preference is to limit the use of the price-to-earnings ratio to establishing what the market thinks about the overall health of a company.
We've established that Analyst I.M.S. Investment Management Services currently trades on a much higher than expected P/E since its recent earnings have been in decline over the medium-term. When we see earnings heading backwards and underperforming the market forecasts, we suspect the share price is at risk of declining, sending the high P/E lower. Unless the recent medium-term conditions improve markedly, it's very challenging to accept these prices as being reasonable.
It's always necessary to consider the ever-present spectre of investment risk. We've identified 4 warning signs with Analyst I.M.S. Investment Management Services, and understanding these should be part of your investment process.
If you're unsure about the strength of Analyst I.M.S. Investment Management Services' business, why not explore our interactive list of stocks with solid business fundamentals for some other companies you may have missed.
If you’re looking to trade Analyst I.M.S. Investment Management Services, open an account with the lowest-cost* platform trusted by professionals, Interactive Brokers. Their clients from over 200 countries and territories trade stocks, options, futures, forex, bonds and funds worldwide from a single integrated account. Promoted
New: Manage All Your Stock Portfolios in One Place
We've created the ultimate portfolio companion for stock investors, and it's free.
• Connect an unlimited number of Portfolios and see your total in one currency
• Be alerted to new Warning Signs or Risks via email or mobile
• Track the Fair Value of your stocks
This article by Simply Wall St is general in nature. It does not constitute a recommendation to buy or sell any stock, and does not take account of your objectives, or your financial situation. We aim to bring you long-term focused analysis driven by fundamental data. Note that our analysis may not factor in the latest price-sensitive company announcements or qualitative material. Simply Wall St has no position in any stocks mentioned.
*Interactive Brokers Rated Lowest Cost Broker by StockBrokers.com Annual Online Review 2020
Have feedback on this article? Concerned about the content? Get in touch with us directly. Alternatively, email editorial-team (at) simplywallst.com.
About TASE:ANLT
Analyst I.M.S. Investment Management Services
A publicly owned investment manager.
Flawless balance sheet with solid track record.
Market Insights
Community Narratives


Recently Updated Narratives


MINISO's fair value is projected at 26.69 with an anticipated PE ratio shift of 20x


The Quiet Giant That Became AI’s Power Grid


Nova Ljubljanska Banka d.d will expect a 11.2% revenue boost driving future growth
Popular Narratives


The company that turned a verb into a global necessity and basically runs the modern internet, digital ads, smartphones, maps, and AI.


MicroVision will explode future revenue by 380.37% with a vision towards success


