
Advertisement
- Israel
- /
- Consumer Durables
- /
- TASE:NTGR
Capital Allocation Trends At Netanel Group (TLV:NTGR) Aren't Ideal
Finding a business that has the potential to grow substantially is not easy, but it is possible if we look at a few key financial metrics. In a perfect world, we'd like to see a company investing more capital into its business and ideally the returns earned from that capital are also increasing. This shows us that it's a compounding machine, able to continually reinvest its earnings back into the business and generate higher returns. Having said that, from a first glance at Netanel Group (TLV:NTGR) we aren't jumping out of our chairs at how returns are trending, but let's have a deeper look.
What is Return On Capital Employed (ROCE)?
If you haven't worked with ROCE before, it measures the 'return' (pre-tax profit) a company generates from capital employed in its business. To calculate this metric for Netanel Group, this is the formula:
Return on Capital Employed = Earnings Before Interest and Tax (EBIT) ÷ (Total Assets - Current Liabilities)
0.07 = ₪34m ÷ (₪1.0b - ₪520m) (Based on the trailing twelve months to December 2020).
Therefore, Netanel Group has an ROCE of 7.0%. Ultimately, that's a low return and it under-performs the Consumer Durables industry average of 10%.
Check out our latest analysis for Netanel Group
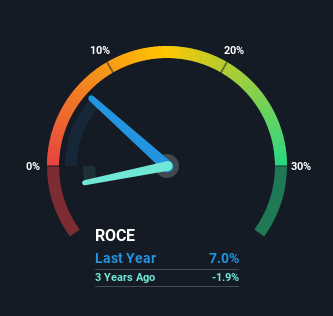
Historical performance is a great place to start when researching a stock so above you can see the gauge for Netanel Group's ROCE against it's prior returns. If you're interested in investigating Netanel Group's past further, check out this free graph of past earnings, revenue and cash flow.
What Does the ROCE Trend For Netanel Group Tell Us?
In terms of Netanel Group's historical ROCE movements, the trend isn't fantastic. Around five years ago the returns on capital were 9.6%, but since then they've fallen to 7.0%. Although, given both revenue and the amount of assets employed in the business have increased, it could suggest the company is investing in growth, and the extra capital has led to a short-term reduction in ROCE. And if the increased capital generates additional returns, the business, and thus shareholders, will benefit in the long run.
On a separate but related note, it's important to know that Netanel Group has a current liabilities to total assets ratio of 51%, which we'd consider pretty high. This effectively means that suppliers (or short-term creditors) are funding a large portion of the business, so just be aware that this can introduce some elements of risk. While it's not necessarily a bad thing, it can be beneficial if this ratio is lower.
The Key Takeaway
In summary, despite lower returns in the short term, we're encouraged to see that Netanel Group is reinvesting for growth and has higher sales as a result. Furthermore the stock has climbed 72% over the last five years, it would appear that investors are upbeat about the future. So while investors seem to be recognizing these promising trends, we would look further into this stock to make sure the other metrics justify the positive view.
One more thing: We've identified 4 warning signs with Netanel Group (at least 1 which is significant) , and understanding them would certainly be useful.
While Netanel Group may not currently earn the highest returns, we've compiled a list of companies that currently earn more than 25% return on equity. Check out this free list here.
If you're looking for stocks to buy, use the lowest-cost* platform that is rated #1 Overall by Barron’s, Interactive Brokers. Trade stocks, options, futures, forex, bonds and funds on 135 markets, all from a single integrated account. Promoted
Valuation is complex, but we're here to simplify it.
Discover if Netanel Group might be undervalued or overvalued with our detailed analysis, featuring fair value estimates, potential risks, dividends, insider trades, and its financial condition.
Access Free AnalysisThis article by Simply Wall St is general in nature. It does not constitute a recommendation to buy or sell any stock, and does not take account of your objectives, or your financial situation. We aim to bring you long-term focused analysis driven by fundamental data. Note that our analysis may not factor in the latest price-sensitive company announcements or qualitative material. Simply Wall St has no position in any stocks mentioned.
*Interactive Brokers Rated Lowest Cost Broker by StockBrokers.com Annual Online Review 2020
Have feedback on this article? Concerned about the content? Get in touch with us directly. Alternatively, email editorial-team (at) simplywallst.com.
About TASE:NTGR
Netanel Group
Engages in the construction business in Israel and the United States.
Slight risk second-rate dividend payer.
Market Insights

Advertisement
Community Narratives
MINISO's fair value is projected at 26.69 with an anticipated PE ratio shift of 20x
Fair Value US$24.03|11.0% undervalued
BE
Community Contributor
Procter & Gamble: A Dividend Giant Facing Slowing Growth
Fair Value US$119.81|23.3% overvalued
AN
Community Contributor
Eli Lilly's Future Growth Driven by Tirzepatide and Favorable Market Conditions
Fair Value US$1.19k|13.8% undervalued
EA
Community Contributor