
Advertisement
- Israel
- /
- Commercial Services
- /
- TASE:ARAN
The Returns At Aran Research & Development (1982) (TLV:ARAN) Aren't Growing
What trends should we look for it we want to identify stocks that can multiply in value over the long term? Firstly, we'll want to see a proven return on capital employed (ROCE) that is increasing, and secondly, an expanding base of capital employed. Ultimately, this demonstrates that it's a business that is reinvesting profits at increasing rates of return. In light of that, when we looked at Aran Research & Development (1982) (TLV:ARAN) and its ROCE trend, we weren't exactly thrilled.
Understanding Return On Capital Employed (ROCE)
If you haven't worked with ROCE before, it measures the 'return' (pre-tax profit) a company generates from capital employed in its business. Analysts use this formula to calculate it for Aran Research & Development (1982):
Return on Capital Employed = Earnings Before Interest and Tax (EBIT) ÷ (Total Assets - Current Liabilities)
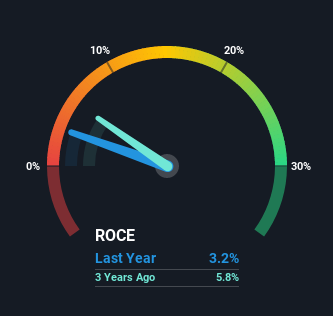
0.032 = ₪2.6m ÷ (₪154m - ₪74m) (Based on the trailing twelve months to December 2020).
So, Aran Research & Development (1982) has an ROCE of 3.2%. In absolute terms, that's a low return and it also under-performs the Commercial Services industry average of 8.3%.
Check out our latest analysis for Aran Research & Development (1982)
While the past is not representative of the future, it can be helpful to know how a company has performed historically, which is why we have this chart above. If you want to delve into the historical earnings, revenue and cash flow of Aran Research & Development (1982), check out these free graphs here.
The Trend Of ROCE
Over the past five years, Aran Research & Development (1982)'s ROCE and capital employed have both remained mostly flat. Businesses with these traits tend to be mature and steady operations because they're past the growth phase. So unless we see a substantial change at Aran Research & Development (1982) in terms of ROCE and additional investments being made, we wouldn't hold our breath on it being a multi-bagger.
On another note, while the change in ROCE trend might not scream for attention, it's interesting that the current liabilities have actually gone up over the last five years. This is intriguing because if current liabilities hadn't increased to 48% of total assets, this reported ROCE would probably be less than3.2% because total capital employed would be higher.The 3.2% ROCE could be even lower if current liabilities weren't 48% of total assets, because the the formula would show a larger base of total capital employed. Additionally, this high level of current liabilities isn't ideal because it means the company's suppliers (or short-term creditors) are effectively funding a large portion of the business.
The Bottom Line
In a nutshell, Aran Research & Development (1982) has been trudging along with the same returns from the same amount of capital over the last five years. And in the last five years, the stock has given away 22% so the market doesn't look too hopeful on these trends strengthening any time soon. All in all, the inherent trends aren't typical of multi-baggers, so if that's what you're after, we think you might have more luck elsewhere.
Aran Research & Development (1982) does have some risks, we noticed 3 warning signs (and 1 which makes us a bit uncomfortable) we think you should know about.
While Aran Research & Development (1982) isn't earning the highest return, check out this free list of companies that are earning high returns on equity with solid balance sheets.
If you're looking for stocks to buy, use the lowest-cost* platform that is rated #1 Overall by Barron’s, Interactive Brokers. Trade stocks, options, futures, forex, bonds and funds on 135 markets, all from a single integrated account. Promoted
New: Manage All Your Stock Portfolios in One Place
We've created the ultimate portfolio companion for stock investors, and it's free.
• Connect an unlimited number of Portfolios and see your total in one currency
• Be alerted to new Warning Signs or Risks via email or mobile
• Track the Fair Value of your stocks
This article by Simply Wall St is general in nature. It does not constitute a recommendation to buy or sell any stock, and does not take account of your objectives, or your financial situation. We aim to bring you long-term focused analysis driven by fundamental data. Note that our analysis may not factor in the latest price-sensitive company announcements or qualitative material. Simply Wall St has no position in any stocks mentioned.
*Interactive Brokers Rated Lowest Cost Broker by StockBrokers.com Annual Online Review 2020
Have feedback on this article? Concerned about the content? Get in touch with us directly. Alternatively, email editorial-team (at) simplywallst.com.
About TASE:ARAN
Aran Research & Development (1982)
Engages in the product design and development, and equipment manufacturing businesses for plastics industry in Israel.
Flawless balance sheet with solid track record and pays a dividend.
Market Insights

Advertisement
Community Narratives
MINISO's fair value is projected at 26.69 with an anticipated PE ratio shift of 20x
Fair Value US$24.03|11.0% undervalued
BE
Community Contributor
Procter & Gamble: A Dividend Giant Facing Slowing Growth
Fair Value US$119.81|23.3% overvalued
AN
Community Contributor
Eli Lilly's Future Growth Driven by Tirzepatide and Favorable Market Conditions
Fair Value US$1.19k|13.8% undervalued
EA
Community Contributor