
Advertisement
- Israel
- /
- Electrical
- /
- TASE:PAYT
Are Payton Industries Ltd's (TLV:PAYT) Fundamentals Good Enough to Warrant Buying Given The Stock's Recent Weakness?
Payton Industries (TLV:PAYT) has had a rough month with its share price down 11%. But if you pay close attention, you might find that its key financial indicators look quite decent, which could mean that the stock could potentially rise in the long-term given how markets usually reward more resilient long-term fundamentals. In this article, we decided to focus on Payton Industries' ROE.
ROE or return on equity is a useful tool to assess how effectively a company can generate returns on the investment it received from its shareholders. Simply put, it is used to assess the profitability of a company in relation to its equity capital.
View our latest analysis for Payton Industries
How Do You Calculate Return On Equity?
ROE can be calculated by using the formula:
Return on Equity = Net Profit (from continuing operations) ÷ Shareholders' Equity
So, based on the above formula, the ROE for Payton Industries is:
25% = US$16m ÷ US$64m (Based on the trailing twelve months to March 2023).
The 'return' is the profit over the last twelve months. So, this means that for every ₪1 of its shareholder's investments, the company generates a profit of ₪0.25.
What Is The Relationship Between ROE And Earnings Growth?
So far, we've learned that ROE is a measure of a company's profitability. We now need to evaluate how much profit the company reinvests or "retains" for future growth which then gives us an idea about the growth potential of the company. Assuming all else is equal, companies that have both a higher return on equity and higher profit retention are usually the ones that have a higher growth rate when compared to companies that don't have the same features.
A Side By Side comparison of Payton Industries' Earnings Growth And 25% ROE
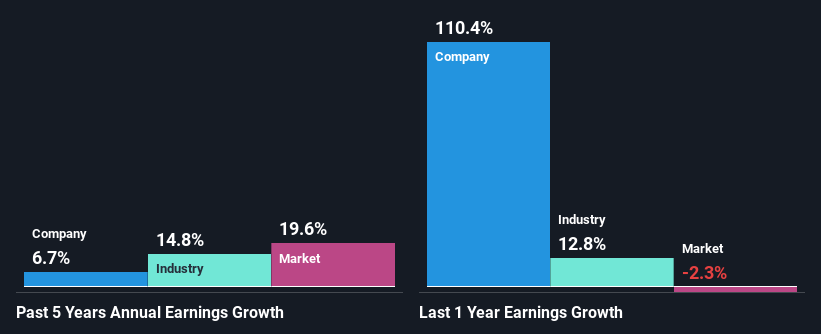
Firstly, we acknowledge that Payton Industries has a significantly high ROE. Second, a comparison with the average ROE reported by the industry of 8.2% also doesn't go unnoticed by us. This probably laid the groundwork for Payton Industries' moderate 6.7% net income growth seen over the past five years.
We then compared Payton Industries' net income growth with the industry and found that the company's growth figure is lower than the average industry growth rate of 15% in the same 5-year period, which is a bit concerning.
The basis for attaching value to a company is, to a great extent, tied to its earnings growth. The investor should try to establish if the expected growth or decline in earnings, whichever the case may be, is priced in. Doing so will help them establish if the stock's future looks promising or ominous. Is Payton Industries fairly valued compared to other companies? These 3 valuation measures might help you decide.
Is Payton Industries Using Its Retained Earnings Effectively?
The high three-year median payout ratio of 75% (or a retention ratio of 25%) for Payton Industries suggests that the company's growth wasn't really hampered despite it returning most of its income to its shareholders.
Besides, Payton Industries has been paying dividends over a period of seven years. This shows that the company is committed to sharing profits with its shareholders.
Conclusion
In total, it does look like Payton Industries has some positive aspects to its business. Its earnings have grown respectably as we saw earlier, which was likely due to the company reinvesting its earnings at a pretty high rate of return. However, given the high ROE, we do think that the company is reinvesting a small portion of its profits. This could likely be preventing the company from growing to its full extent. Up till now, we've only made a short study of the company's growth data. To gain further insights into Payton Industries' past profit growth, check out this visualization of past earnings, revenue and cash flows.
New: Manage All Your Stock Portfolios in One Place
We've created the ultimate portfolio companion for stock investors, and it's free.
• Connect an unlimited number of Portfolios and see your total in one currency
• Be alerted to new Warning Signs or Risks via email or mobile
• Track the Fair Value of your stocks
Have feedback on this article? Concerned about the content? Get in touch with us directly. Alternatively, email editorial-team (at) simplywallst.com.
This article by Simply Wall St is general in nature. We provide commentary based on historical data and analyst forecasts only using an unbiased methodology and our articles are not intended to be financial advice. It does not constitute a recommendation to buy or sell any stock, and does not take account of your objectives, or your financial situation. We aim to bring you long-term focused analysis driven by fundamental data. Note that our analysis may not factor in the latest price-sensitive company announcements or qualitative material. Simply Wall St has no position in any stocks mentioned.
About TASE:PAYT
Payton Industries
Develops, produces, trades, markets, and sells various types of transformers for communications, electronics, automotive, and industrial equipment industries in Israel, Europe, the United States, and Asia.
Flawless balance sheet average dividend payer.
Market Insights

Advertisement
Community Narratives
MINISO's fair value is projected at 26.69 with an anticipated PE ratio shift of 20x
Fair Value US$24.03|12.0% undervalued
BE
Community Contributor
Procter & Gamble: A Dividend Giant Facing Slowing Growth
Fair Value US$119.81|21.7% overvalued
AN
Community Contributor
Eli Lilly's Future Growth Driven by Tirzepatide and Favorable Market Conditions
Fair Value US$1.19k|14.1% undervalued
EA
Community Contributor