Stock Analysis
- Israel
- /
- Aerospace & Defense
- /
- TASE:ORBI
Orbit Technologies Full Year 2023 Earnings: EPS: US$0.40 (vs US$0.49 in FY 2022)


Orbit Technologies (TLV:ORBI) Full Year 2023 Results
Key Financial Results
- Revenue: US$63.0m (up 6.8% from FY 2022).
- Net income: US$9.90m (up 2.3% from FY 2022).
- Profit margin: 16% (in line with FY 2022).
- EPS: US$0.40.
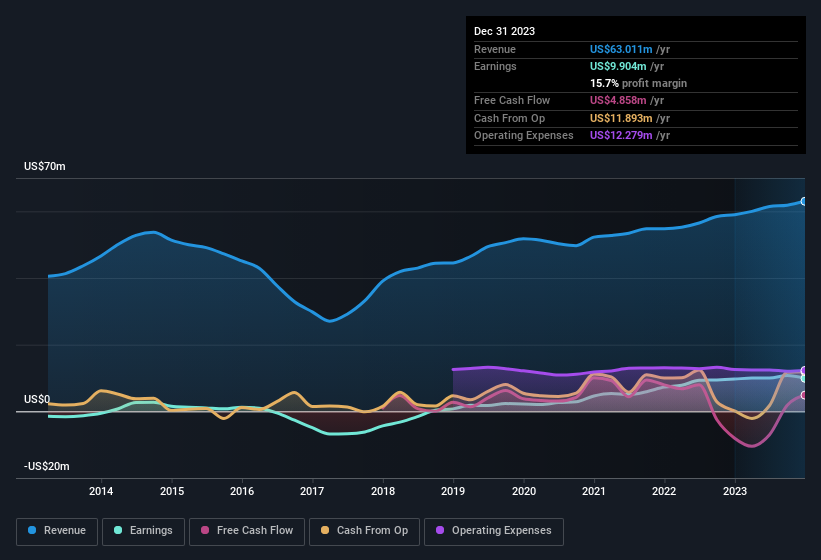
All figures shown in the chart above are for the trailing 12 month (TTM) period
Orbit Technologies shares are up 1.7% from a week ago.
Balance Sheet Analysis
While earnings are important, another area to consider is the balance sheet. We have a graphic representation of Orbit Technologies' balance sheet and an in-depth analysis of the company's financial position.
New: AI Stock Screener & Alerts
Our new AI Stock Screener scans the market every day to uncover opportunities.
• Dividend Powerhouses (3%+ Yield)
• Undervalued Small Caps with Insider Buying
• High growth Tech and AI Companies
Or build your own from over 50 metrics.
Have feedback on this article? Concerned about the content? Get in touch with us directly. Alternatively, email editorial-team (at) simplywallst.com.
This article by Simply Wall St is general in nature. We provide commentary based on historical data and analyst forecasts only using an unbiased methodology and our articles are not intended to be financial advice. It does not constitute a recommendation to buy or sell any stock, and does not take account of your objectives, or your financial situation. We aim to bring you long-term focused analysis driven by fundamental data. Note that our analysis may not factor in the latest price-sensitive company announcements or qualitative material. Simply Wall St has no position in any stocks mentioned.
About TASE:ORBI
Orbit Technologies
Provides airborne communications, and satellite-tracking maritime and ground-station solutions in Israel and internationally.
Flawless balance sheet and good value.
