Stock Analysis
- Hungary
- /
- Oil and Gas
- /
- BUSE:MOL
MOL Magyar Olaj- és Gázipari Nyilvánosan Muködo Részvénytársaság (BUSE:MOL) shareholders have earned a 20% CAGR over the last three years


Investors can buy low cost index fund if they want to receive the average market return. But across the board there are plenty of stocks that underperform the market. Unfortunately for shareholders, while the MOL Magyar Olaj- és Gázipari Nyilvánosan Muködo Részvénytársaság (BUSE:MOL) share price is up 23% in the last three years, that falls short of the market return. Zooming in, the stock is actually down 9.1% in the last year.
Now it's worth having a look at the company's fundamentals too, because that will help us determine if the long term shareholder return has matched the performance of the underlying business.
Check out our latest analysis for MOL Magyar Olaj- és Gázipari Nyilvánosan Muködo Részvénytársaság
While markets are a powerful pricing mechanism, share prices reflect investor sentiment, not just underlying business performance. One flawed but reasonable way to assess how sentiment around a company has changed is to compare the earnings per share (EPS) with the share price.
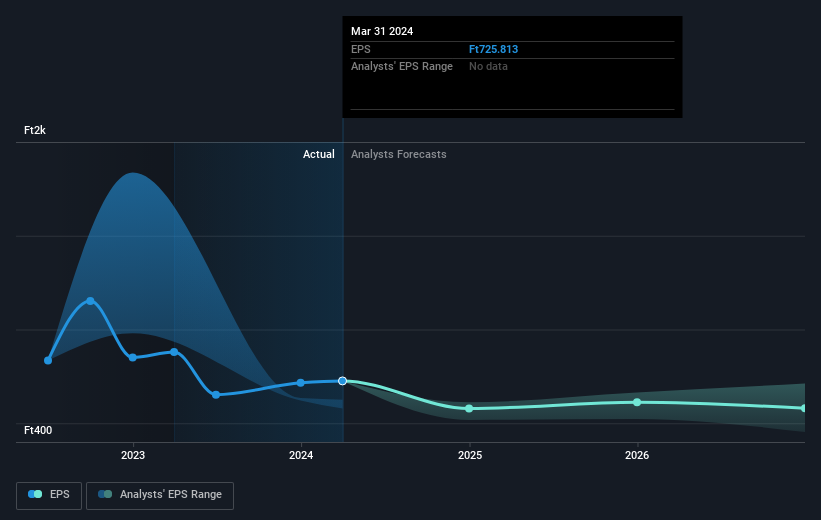
MOL Magyar Olaj- és Gázipari Nyilvánosan Muködo Részvénytársaság was able to grow its EPS at 60% per year over three years, sending the share price higher. The average annual share price increase of 7% is actually lower than the EPS growth. So it seems investors have become more cautious about the company, over time. This cautious sentiment is reflected in its (fairly low) P/E ratio of 3.91.
The graphic below depicts how EPS has changed over time (unveil the exact values by clicking on the image).
We know that MOL Magyar Olaj- és Gázipari Nyilvánosan Muködo Részvénytársaság has improved its bottom line over the last three years, but what does the future have in store? If you are thinking of buying or selling MOL Magyar Olaj- és Gázipari Nyilvánosan Muködo Részvénytársaság stock, you should check out this FREE detailed report on its balance sheet.
What About Dividends?
As well as measuring the share price return, investors should also consider the total shareholder return (TSR). The TSR is a return calculation that accounts for the value of cash dividends (assuming that any dividend received was reinvested) and the calculated value of any discounted capital raisings and spin-offs. So for companies that pay a generous dividend, the TSR is often a lot higher than the share price return. In the case of MOL Magyar Olaj- és Gázipari Nyilvánosan Muködo Részvénytársaság, it has a TSR of 74% for the last 3 years. That exceeds its share price return that we previously mentioned. The dividends paid by the company have thusly boosted the total shareholder return.
A Different Perspective
MOL Magyar Olaj- és Gázipari Nyilvánosan Muködo Részvénytársaság shareholders gained a total return of 11% during the year. But that was short of the market average. The silver lining is that the gain was actually better than the average annual return of 5% per year over five year. It is possible that returns will improve along with the business fundamentals. I find it very interesting to look at share price over the long term as a proxy for business performance. But to truly gain insight, we need to consider other information, too. Even so, be aware that MOL Magyar Olaj- és Gázipari Nyilvánosan Muködo Részvénytársaság is showing 2 warning signs in our investment analysis , and 1 of those is a bit unpleasant...
If you like to buy stocks alongside management, then you might just love this free list of companies. (Hint: many of them are unnoticed AND have attractive valuation).
Please note, the market returns quoted in this article reflect the market weighted average returns of stocks that currently trade on Hungarian exchanges.
New: Manage All Your Stock Portfolios in One Place
We've created the ultimate portfolio companion for stock investors, and it's free.
• Connect an unlimited number of Portfolios and see your total in one currency
• Be alerted to new Warning Signs or Risks via email or mobile
• Track the Fair Value of your stocks
Have feedback on this article? Concerned about the content? Get in touch with us directly. Alternatively, email editorial-team (at) simplywallst.com.
This article by Simply Wall St is general in nature. We provide commentary based on historical data and analyst forecasts only using an unbiased methodology and our articles are not intended to be financial advice. It does not constitute a recommendation to buy or sell any stock, and does not take account of your objectives, or your financial situation. We aim to bring you long-term focused analysis driven by fundamental data. Note that our analysis may not factor in the latest price-sensitive company announcements or qualitative material. Simply Wall St has no position in any stocks mentioned.
Have feedback on this article? Concerned about the content? Get in touch with us directly. Alternatively, email editorial-team@simplywallst.com
About BUSE:MOL
MOL Magyar Olaj- és Gázipari Nyilvánosan Muködo Részvénytársaság
Operates as an integrated oil and gas company in Hungary and internationally.
Flawless balance sheet, undervalued and pays a dividend.
