
Advertisement
- Croatia
- /
- Industrials
- /
- ZGSE:ADRS
Adris grupa d. d. (ZGSE:ADRS) On An Uptrend: Could Fundamentals Be Driving The Stock?

Most readers would already know that Adris grupa d. d's (ZGSE:ADRS) stock increased by 3.9% over the past week. Given that stock prices are usually aligned with a company's financial performance in the long-term, we decided to investigate if the company's decent financials had a hand to play in the recent price move. Particularly, we will be paying attention to Adris grupa d. d's ROE today.
Return on equity or ROE is an important factor to be considered by a shareholder because it tells them how effectively their capital is being reinvested. In short, ROE shows the profit each dollar generates with respect to its shareholder investments.
Check out our latest analysis for Adris grupa d. d
How To Calculate Return On Equity?
ROE can be calculated by using the formula:
Return on Equity = Net Profit (from continuing operations) ÷ Shareholders' Equity
So, based on the above formula, the ROE for Adris grupa d. d is:
5.4% = €84m ÷ €1.6b (Based on the trailing twelve months to June 2024).
The 'return' is the yearly profit. So, this means that for every €1 of its shareholder's investments, the company generates a profit of €0.05.
What Is The Relationship Between ROE And Earnings Growth?
Thus far, we have learned that ROE measures how efficiently a company is generating its profits. We now need to evaluate how much profit the company reinvests or "retains" for future growth which then gives us an idea about the growth potential of the company. Assuming everything else remains unchanged, the higher the ROE and profit retention, the higher the growth rate of a company compared to companies that don't necessarily bear these characteristics.
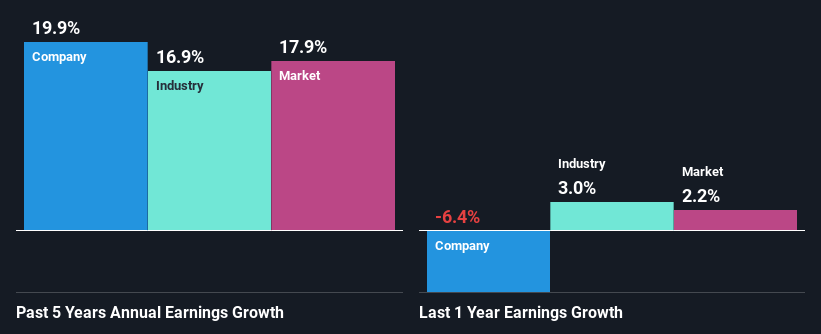
Adris grupa d. d's Earnings Growth And 5.4% ROE
At first glance, Adris grupa d. d's ROE doesn't look very promising. A quick further study shows that the company's ROE doesn't compare favorably to the industry average of 8.3% either. However, the moderate 20% net income growth seen by Adris grupa d. d over the past five years is definitely a positive. So, the growth in the company's earnings could probably have been caused by other variables. For instance, the company has a low payout ratio or is being managed efficiently.
Next, on comparing Adris grupa d. d's net income growth with the industry, we found that the company's reported growth is similar to the industry average growth rate of 17% over the last few years.
Earnings growth is an important metric to consider when valuing a stock. The investor should try to establish if the expected growth or decline in earnings, whichever the case may be, is priced in. Doing so will help them establish if the stock's future looks promising or ominous. One good indicator of expected earnings growth is the P/E ratio which determines the price the market is willing to pay for a stock based on its earnings prospects. So, you may want to check if Adris grupa d. d is trading on a high P/E or a low P/E, relative to its industry.
Is Adris grupa d. d Making Efficient Use Of Its Profits?
The high three-year median payout ratio of 62% (or a retention ratio of 38%) for Adris grupa d. d suggests that the company's growth wasn't really hampered despite it returning most of its income to its shareholders.
Moreover, Adris grupa d. d is determined to keep sharing its profits with shareholders which we infer from its long history of paying a dividend for at least ten years.
Conclusion
Overall, we feel that Adris grupa d. d certainly does have some positive factors to consider. While no doubt its earnings growth is pretty substantial, we do feel that the reinvestment rate is pretty low, meaning, the earnings growth number could have been significantly higher had the company been retaining more of its profits. So far, we've only made a quick discussion around the company's earnings growth. So it may be worth checking this free detailed graph of Adris grupa d. d's past earnings, as well as revenue and cash flows to get a deeper insight into the company's performance.
New: Manage All Your Stock Portfolios in One Place
We've created the ultimate portfolio companion for stock investors, and it's free.
• Connect an unlimited number of Portfolios and see your total in one currency
• Be alerted to new Warning Signs or Risks via email or mobile
• Track the Fair Value of your stocks
Have feedback on this article? Concerned about the content? Get in touch with us directly. Alternatively, email editorial-team (at) simplywallst.com.
This article by Simply Wall St is general in nature. We provide commentary based on historical data and analyst forecasts only using an unbiased methodology and our articles are not intended to be financial advice. It does not constitute a recommendation to buy or sell any stock, and does not take account of your objectives, or your financial situation. We aim to bring you long-term focused analysis driven by fundamental data. Note that our analysis may not factor in the latest price-sensitive company announcements or qualitative material. Simply Wall St has no position in any stocks mentioned.
About ZGSE:ADRS
Adris grupa d. d
Engages in the tourism, healthy food, insurance, and real estate businesses in Croatia and internationally.
Proven track record with adequate balance sheet.
Market Insights

Advertisement
Community Narratives
WhiteCap Is Positioned To Profit Regardless Of Trump's Policy 
Fair Value CA$22.60|61.6% undervalued
ST
Equity Analyst and Writer
Microsoft's Evolution Will Drive Revenue to New Heights Fueled by AI
Fair Value US$360.00|29.9% overvalued
BR
Community Contributor
A CASE FOR USD$2.50 (CAD$3.44) BY 2028 (A 5-10 BAGGER)
Fair Value CA$3.44|87.8% undervalued
AG
Community Contributor