
Advertisement
- Hong Kong
- /
- Renewable Energy
- /
- SEHK:451
GCL New Energy Holdings Limited's (HKG:451) 33% Share Price Surge Not Quite Adding Up
GCL New Energy Holdings Limited (HKG:451) shares have had a really impressive month, gaining 33% after a shaky period beforehand. Unfortunately, the gains of the last month did little to right the losses of the last year with the stock still down 27% over that time.
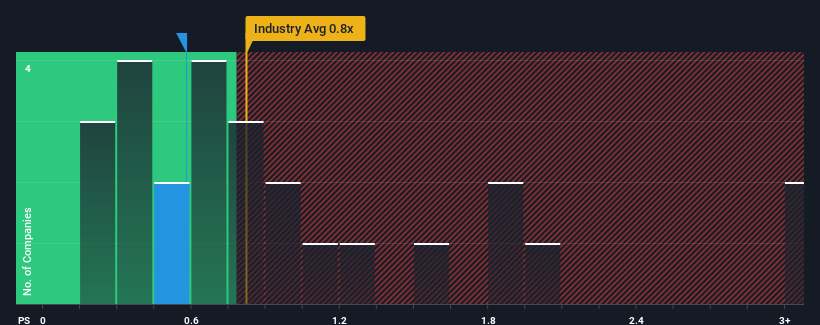
Even after such a large jump in price, it's still not a stretch to say that GCL New Energy Holdings' price-to-sales (or "P/S") ratio of 0.6x right now seems quite "middle-of-the-road" compared to the Renewable Energy industry in Hong Kong, where the median P/S ratio is around 0.8x. While this might not raise any eyebrows, if the P/S ratio is not justified investors could be missing out on a potential opportunity or ignoring looming disappointment.
Check out our latest analysis for GCL New Energy Holdings
How Has GCL New Energy Holdings Performed Recently?
As an illustration, revenue has deteriorated at GCL New Energy Holdings over the last year, which is not ideal at all. One possibility is that the P/S is moderate because investors think the company might still do enough to be in line with the broader industry in the near future. If not, then existing shareholders may be a little nervous about the viability of the share price.
We don't have analyst forecasts, but you can see how recent trends are setting up the company for the future by checking out our free report on GCL New Energy Holdings' earnings, revenue and cash flow.Do Revenue Forecasts Match The P/S Ratio?
In order to justify its P/S ratio, GCL New Energy Holdings would need to produce growth that's similar to the industry.
Retrospectively, the last year delivered a frustrating 10% decrease to the company's top line. As a result, revenue from three years ago have also fallen 83% overall. Accordingly, shareholders would have felt downbeat about the medium-term rates of revenue growth.
Comparing that to the industry, which is predicted to deliver 5.6% growth in the next 12 months, the company's downward momentum based on recent medium-term revenue results is a sobering picture.
With this information, we find it concerning that GCL New Energy Holdings is trading at a fairly similar P/S compared to the industry. It seems most investors are ignoring the recent poor growth rate and are hoping for a turnaround in the company's business prospects. Only the boldest would assume these prices are sustainable as a continuation of recent revenue trends is likely to weigh on the share price eventually.
The Bottom Line On GCL New Energy Holdings' P/S
GCL New Energy Holdings' stock has a lot of momentum behind it lately, which has brought its P/S level with the rest of the industry. Using the price-to-sales ratio alone to determine if you should sell your stock isn't sensible, however it can be a practical guide to the company's future prospects.
We find it unexpected that GCL New Energy Holdings trades at a P/S ratio that is comparable to the rest of the industry, despite experiencing declining revenues during the medium-term, while the industry as a whole is expected to grow. Even though it matches the industry, we're uncomfortable with the current P/S ratio, as this dismal revenue performance is unlikely to support a more positive sentiment for long. If recent medium-term revenue trends continue, it will place shareholders' investments at risk and potential investors in danger of paying an unnecessary premium.
Plus, you should also learn about these 2 warning signs we've spotted with GCL New Energy Holdings (including 1 which shouldn't be ignored).
If you're unsure about the strength of GCL New Energy Holdings' business, why not explore our interactive list of stocks with solid business fundamentals for some other companies you may have missed.
New: Manage All Your Stock Portfolios in One Place
We've created the ultimate portfolio companion for stock investors, and it's free.
• Connect an unlimited number of Portfolios and see your total in one currency
• Be alerted to new Warning Signs or Risks via email or mobile
• Track the Fair Value of your stocks
Have feedback on this article? Concerned about the content? Get in touch with us directly. Alternatively, email editorial-team (at) simplywallst.com.
This article by Simply Wall St is general in nature. We provide commentary based on historical data and analyst forecasts only using an unbiased methodology and our articles are not intended to be financial advice. It does not constitute a recommendation to buy or sell any stock, and does not take account of your objectives, or your financial situation. We aim to bring you long-term focused analysis driven by fundamental data. Note that our analysis may not factor in the latest price-sensitive company announcements or qualitative material. Simply Wall St has no position in any stocks mentioned.
About SEHK:451
GCL New Energy Holdings
An investment holding company, develops, constructs, operates, and manages solar power plants in the People’s Republic of China and the United States.
Flawless balance sheet and slightly overvalued.
Similar Companies
Market Insights

Advertisement
Community Narratives
MicroVision will explode future revenue by 380.37% with a vision towards success
Fair Value US$60.00|98.4% undervalued
TH
Community Contributor
The Indispensable Artery for a New North American Economy
Fair Value CA$132.87|1.3% undervalued
TI
Community Contributor