Stock Analysis
- Hong Kong
- /
- Renewable Energy
- /
- SEHK:3868
Xinyi Energy Holdings (HKG:3868) Has More To Do To Multiply In Value Going Forward


If you're not sure where to start when looking for the next multi-bagger, there are a few key trends you should keep an eye out for. Amongst other things, we'll want to see two things; firstly, a growing return on capital employed (ROCE) and secondly, an expansion in the company's amount of capital employed. Ultimately, this demonstrates that it's a business that is reinvesting profits at increasing rates of return. However, after investigating Xinyi Energy Holdings (HKG:3868), we don't think it's current trends fit the mold of a multi-bagger.
Return On Capital Employed (ROCE): What is it?
Just to clarify if you're unsure, ROCE is a metric for evaluating how much pre-tax income (in percentage terms) a company earns on the capital invested in its business. To calculate this metric for Xinyi Energy Holdings, this is the formula:
Return on Capital Employed = Earnings Before Interest and Tax (EBIT) ÷ (Total Assets - Current Liabilities)
0.09 = HK$1.2b ÷ (HK$17b - HK$3.8b) (Based on the trailing twelve months to December 2020).
Therefore, Xinyi Energy Holdings has an ROCE of 9.0%. In absolute terms, that's a low return, but it's much better than the Renewable Energy industry average of 7.1%.
View our latest analysis for Xinyi Energy Holdings
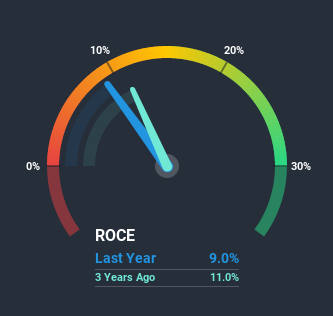
Above you can see how the current ROCE for Xinyi Energy Holdings compares to its prior returns on capital, but there's only so much you can tell from the past. If you'd like to see what analysts are forecasting going forward, you should check out our free report for Xinyi Energy Holdings.
The Trend Of ROCE
There are better returns on capital out there than what we're seeing at Xinyi Energy Holdings. Over the past four years, ROCE has remained relatively flat at around 9.0% and the business has deployed 81% more capital into its operations. Given the company has increased the amount of capital employed, it appears the investments that have been made simply don't provide a high return on capital.
Another point to note, we noticed the company has increased current liabilities over the last four years. This is intriguing because if current liabilities hadn't increased to 22% of total assets, this reported ROCE would probably be less than9.0% because total capital employed would be higher.The 9.0% ROCE could be even lower if current liabilities weren't 22% of total assets, because the the formula would show a larger base of total capital employed. With that in mind, just be wary if this ratio increases in the future, because if it gets particularly high, this brings with it some new elements of risk.
The Key Takeaway
Long story short, while Xinyi Energy Holdings has been reinvesting its capital, the returns that it's generating haven't increased. Although the market must be expecting these trends to improve because the stock has gained 89% over the last year. But if the trajectory of these underlying trends continue, we think the likelihood of it being a multi-bagger from here isn't high.
If you'd like to know about the risks facing Xinyi Energy Holdings, we've discovered 3 warning signs that you should be aware of.
For those who like to invest in solid companies, check out this free list of companies with solid balance sheets and high returns on equity.
When trading Xinyi Energy Holdings or any other investment, use the platform considered by many to be the Professional's Gateway to the Worlds Market, Interactive Brokers. You get the lowest-cost* trading on stocks, options, futures, forex, bonds and funds worldwide from a single integrated account. Promoted
Valuation is complex, but we're helping make it simple.
Find out whether Xinyi Energy Holdings is potentially over or undervalued by checking out our comprehensive analysis, which includes fair value estimates, risks and warnings, dividends, insider transactions and financial health.
View the Free AnalysisThis article by Simply Wall St is general in nature. It does not constitute a recommendation to buy or sell any stock, and does not take account of your objectives, or your financial situation. We aim to bring you long-term focused analysis driven by fundamental data. Note that our analysis may not factor in the latest price-sensitive company announcements or qualitative material. Simply Wall St has no position in any stocks mentioned.
*Interactive Brokers Rated Lowest Cost Broker by StockBrokers.com Annual Online Review 2020
Have feedback on this article? Concerned about the content? Get in touch with us directly. Alternatively, email editorial-team (at) simplywallst.com.
About SEHK:3868
Xinyi Energy Holdings
An investment holding company, owns, operates, and manages solar farms in the People's Republic of China.
Good value with moderate growth potential.
