- Hong Kong
- /
- Renewable Energy
- /
- SEHK:1811
CGN New Energy Holdings (HKG:1811) stock performs better than its underlying earnings growth over last five years

CGN New Energy Holdings Co., Ltd. (HKG:1811) shareholders might be concerned after seeing the share price drop 13% in the last quarter. But that scarcely detracts from the really solid long term returns generated by the company over five years. We think most investors would be happy with the 140% return, over that period. So while it's never fun to see a share price fall, it's important to look at a longer time horizon. Of course, that doesn't necessarily mean it's cheap now. While the returns over the last 5 years have been good, we do feel sorry for those shareholders who haven't held shares that long, because the share price is down 41% in the last three years.
The past week has proven to be lucrative for CGN New Energy Holdings investors, so let's see if fundamentals drove the company's five-year performance.
View our latest analysis for CGN New Energy Holdings
In his essay The Superinvestors of Graham-and-Doddsville Warren Buffett described how share prices do not always rationally reflect the value of a business. One flawed but reasonable way to assess how sentiment around a company has changed is to compare the earnings per share (EPS) with the share price.
Over half a decade, CGN New Energy Holdings managed to grow its earnings per share at 25% a year. This EPS growth is higher than the 19% average annual increase in the share price. So one could conclude that the broader market has become more cautious towards the stock. The reasonably low P/E ratio of 4.59 also suggests market apprehension.
The company's earnings per share (over time) is depicted in the image below (click to see the exact numbers).
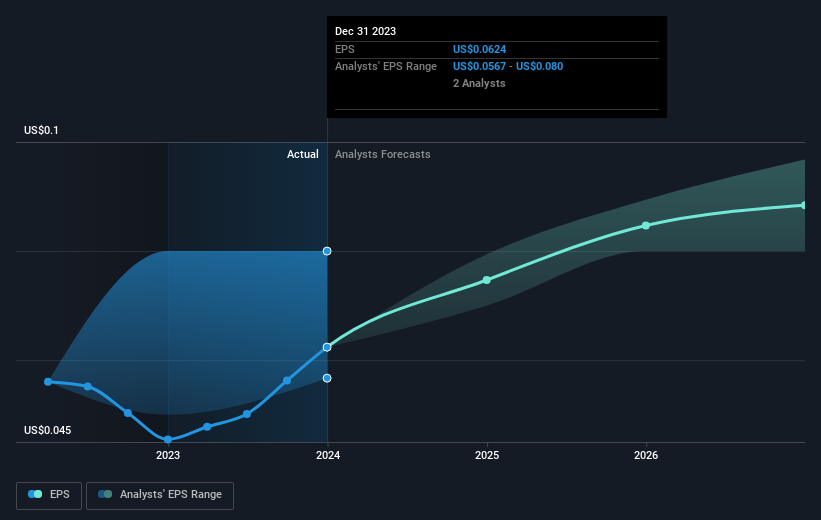
We know that CGN New Energy Holdings has improved its bottom line lately, but is it going to grow revenue? Check if analysts think CGN New Energy Holdings will grow revenue in the future.
What About Dividends?
It is important to consider the total shareholder return, as well as the share price return, for any given stock. Whereas the share price return only reflects the change in the share price, the TSR includes the value of dividends (assuming they were reinvested) and the benefit of any discounted capital raising or spin-off. So for companies that pay a generous dividend, the TSR is often a lot higher than the share price return. As it happens, CGN New Energy Holdings' TSR for the last 5 years was 178%, which exceeds the share price return mentioned earlier. And there's no prize for guessing that the dividend payments largely explain the divergence!
A Different Perspective
We're pleased to report that CGN New Energy Holdings shareholders have received a total shareholder return of 9.6% over one year. Of course, that includes the dividend. However, that falls short of the 23% TSR per annum it has made for shareholders, each year, over five years. The pessimistic view would be that be that the stock has its best days behind it, but on the other hand the price might simply be moderating while the business itself continues to execute. It's always interesting to track share price performance over the longer term. But to understand CGN New Energy Holdings better, we need to consider many other factors. Like risks, for instance. Every company has them, and we've spotted 2 warning signs for CGN New Energy Holdings (of which 1 is a bit unpleasant!) you should know about.
If you are like me, then you will not want to miss this free list of undervalued small caps that insiders are buying.
Please note, the market returns quoted in this article reflect the market weighted average returns of stocks that currently trade on Hong Kong exchanges.
New: AI Stock Screener & Alerts
Our new AI Stock Screener scans the market every day to uncover opportunities.
• Dividend Powerhouses (3%+ Yield)
• Undervalued Small Caps with Insider Buying
• High growth Tech and AI Companies
Or build your own from over 50 metrics.
Have feedback on this article? Concerned about the content? Get in touch with us directly. Alternatively, email editorial-team (at) simplywallst.com.
This article by Simply Wall St is general in nature. We provide commentary based on historical data and analyst forecasts only using an unbiased methodology and our articles are not intended to be financial advice. It does not constitute a recommendation to buy or sell any stock, and does not take account of your objectives, or your financial situation. We aim to bring you long-term focused analysis driven by fundamental data. Note that our analysis may not factor in the latest price-sensitive company announcements or qualitative material. Simply Wall St has no position in any stocks mentioned.
About SEHK:1811
CGN New Energy Holdings
Generates and supplies electricity and steam in the People’s Republic of China and Republic of Korea.
Undervalued with solid track record.
