
Advertisement
- Hong Kong
- /
- Electric Utilities
- /
- SEHK:1671
Tianjin Tianbao Energy (HKG:1671) Will Be Hoping To Turn Its Returns On Capital Around
To find a multi-bagger stock, what are the underlying trends we should look for in a business? Typically, we'll want to notice a trend of growing return on capital employed (ROCE) and alongside that, an expanding base of capital employed. If you see this, it typically means it's a company with a great business model and plenty of profitable reinvestment opportunities. In light of that, when we looked at Tianjin Tianbao Energy (HKG:1671) and its ROCE trend, we weren't exactly thrilled.
What Is Return On Capital Employed (ROCE)?
Just to clarify if you're unsure, ROCE is a metric for evaluating how much pre-tax income (in percentage terms) a company earns on the capital invested in its business. The formula for this calculation on Tianjin Tianbao Energy is:
Return on Capital Employed = Earnings Before Interest and Tax (EBIT) ÷ (Total Assets - Current Liabilities)
0.064 = CN¥44m ÷ (CN¥1.1b - CN¥372m) (Based on the trailing twelve months to June 2023).
Thus, Tianjin Tianbao Energy has an ROCE of 6.4%. In absolute terms, that's a low return but it's around the Electric Utilities industry average of 5.3%.
Check out our latest analysis for Tianjin Tianbao Energy
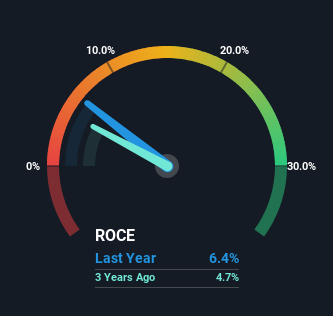
Historical performance is a great place to start when researching a stock so above you can see the gauge for Tianjin Tianbao Energy's ROCE against it's prior returns. If you want to delve into the historical earnings , check out these free graphs detailing revenue and cash flow performance of Tianjin Tianbao Energy.
How Are Returns Trending?
On the surface, the trend of ROCE at Tianjin Tianbao Energy doesn't inspire confidence. Around five years ago the returns on capital were 12%, but since then they've fallen to 6.4%. However, given capital employed and revenue have both increased it appears that the business is currently pursuing growth, at the consequence of short term returns. And if the increased capital generates additional returns, the business, and thus shareholders, will benefit in the long run.
While on the subject, we noticed that the ratio of current liabilities to total assets has risen to 35%, which has impacted the ROCE. Without this increase, it's likely that ROCE would be even lower than 6.4%. Keep an eye on this ratio, because the business could encounter some new risks if this metric gets too high.
In Conclusion...
Even though returns on capital have fallen in the short term, we find it promising that revenue and capital employed have both increased for Tianjin Tianbao Energy. And there could be an opportunity here if other metrics look good too, because the stock has declined 51% in the last five years. So we think it'd be worthwhile to look further into this stock given the trends look encouraging.
Tianjin Tianbao Energy does have some risks, we noticed 5 warning signs (and 3 which make us uncomfortable) we think you should know about.
While Tianjin Tianbao Energy isn't earning the highest return, check out this free list of companies that are earning high returns on equity with solid balance sheets.
Valuation is complex, but we're here to simplify it.
Discover if Tianjin Tianbao Energy might be undervalued or overvalued with our detailed analysis, featuring fair value estimates, potential risks, dividends, insider trades, and its financial condition.
Access Free AnalysisHave feedback on this article? Concerned about the content? Get in touch with us directly. Alternatively, email editorial-team (at) simplywallst.com.
This article by Simply Wall St is general in nature. We provide commentary based on historical data and analyst forecasts only using an unbiased methodology and our articles are not intended to be financial advice. It does not constitute a recommendation to buy or sell any stock, and does not take account of your objectives, or your financial situation. We aim to bring you long-term focused analysis driven by fundamental data. Note that our analysis may not factor in the latest price-sensitive company announcements or qualitative material. Simply Wall St has no position in any stocks mentioned.
About SEHK:1671
Tianjin Tianbao Energy
Generates and supplies power in the People's Republic of China.
Proven track record with mediocre balance sheet.
Market Insights

Advertisement
Community Narratives
MicroVision will explode future revenue by 380.37% with a vision towards success
Fair Value US$60|98.4% undervalued
TH
Community Contributor
The Indispensable Artery for a New North American Economy
Fair Value CA$132.87|0.6% undervalued
TI
Community Contributor
Recently Updated Narratives
MA


MarkoVT on COVER ·
Q3 Outlook modestly optimistic
Fair Value:JP¥1.65k2.0% overvalued
1 followerusers have followed this narrative
0 commentsusers have commented on this narrative
0 likesusers have liked this narrative
BL


BlackGoat on Alphabet ·
Alphabet: The Under-appreciated Compounder Hiding in Plain Sight
Fair Value:US$324.481.3% undervalued
76 followersusers have followed this narrative
3 commentsusers have commented on this narrative
1 likeusers have liked this narrative
BE


Bejgal on MINISO Group Holding ·
MINISO's fair value is projected at 26.69 with an anticipated PE ratio shift of 20x
Fair Value:US$26.6926.7% undervalued
46 followersusers have followed this narrative
3 commentsusers have commented on this narrative
0 likesusers have liked this narrative
Popular Narratives
OS

oscargarcia on Alphabet ·
The company that turned a verb into a global necessity and basically runs the modern internet, digital ads, smartphones, maps, and AI.
Fair Value:US$3405.9% undervalued
136 followersusers have followed this narrative
6 commentsusers have commented on this narrative
18 likesusers have liked this narrative
TH

TheWallstreetKing on MicroVision ·
MicroVision will explode future revenue by 380.37% with a vision towards success
Fair Value:US$6098.4% undervalued
90 followersusers have followed this narrative
10 commentsusers have commented on this narrative
18 likesusers have liked this narrative
AN


AnalystConsensusTarget on NVIDIA ·
NVDA: Expanding AI Demand Will Drive Major Data Center Investments Through 2026
Fair Value:US$232.7922.6% undervalued
928 followersusers have followed this narrative
6 commentsusers have commented on this narrative
22 likesusers have liked this narrative