- Hong Kong
- /
- Gas Utilities
- /
- SEHK:1600
The five-year shareholder returns and company earnings persist lower as Tian Lun Gas Holdings (HKG:1600) stock falls a further 11% in past week

Statistically speaking, long term investing is a profitable endeavour. But that doesn't mean long term investors can avoid big losses. Zooming in on an example, the Tian Lun Gas Holdings Limited (HKG:1600) share price dropped 61% in the last half decade. We certainly feel for shareholders who bought near the top. We also note that the stock has performed poorly over the last year, with the share price down 35%. Unfortunately the share price momentum is still quite negative, with prices down 28% in thirty days.
Given the past week has been tough on shareholders, let's investigate the fundamentals and see what we can learn.
View our latest analysis for Tian Lun Gas Holdings
To paraphrase Benjamin Graham: Over the short term the market is a voting machine, but over the long term it's a weighing machine. By comparing earnings per share (EPS) and share price changes over time, we can get a feel for how investor attitudes to a company have morphed over time.
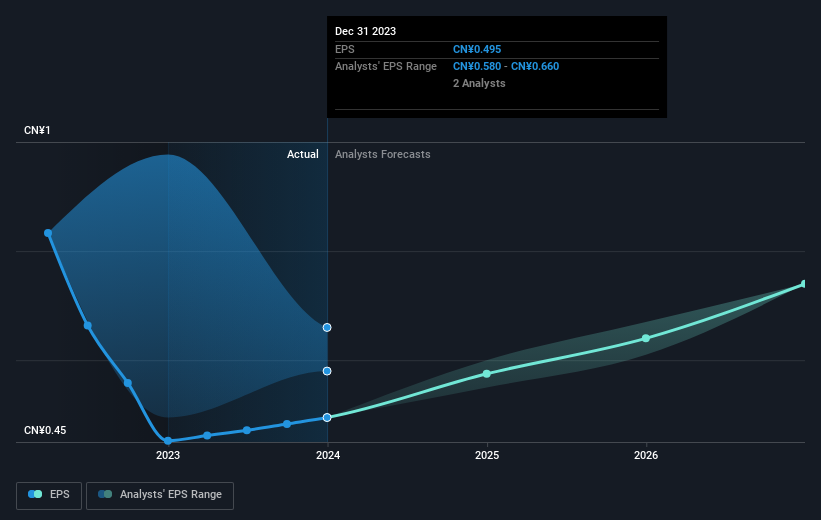
Looking back five years, both Tian Lun Gas Holdings' share price and EPS declined; the latter at a rate of 3.0% per year. This reduction in EPS is less than the 17% annual reduction in the share price. So it seems the market was too confident about the business, in the past. The less favorable sentiment is reflected in its current P/E ratio of 6.58.
The graphic below depicts how EPS has changed over time (unveil the exact values by clicking on the image).
It's good to see that there was some significant insider buying in the last three months. That's a positive. That said, we think earnings and revenue growth trends are even more important factors to consider. This free interactive report on Tian Lun Gas Holdings' earnings, revenue and cash flow is a great place to start, if you want to investigate the stock further.
What About Dividends?
When looking at investment returns, it is important to consider the difference between total shareholder return (TSR) and share price return. The TSR is a return calculation that accounts for the value of cash dividends (assuming that any dividend received was reinvested) and the calculated value of any discounted capital raisings and spin-offs. Arguably, the TSR gives a more comprehensive picture of the return generated by a stock. In the case of Tian Lun Gas Holdings, it has a TSR of -50% for the last 5 years. That exceeds its share price return that we previously mentioned. This is largely a result of its dividend payments!
A Different Perspective
While the broader market gained around 7.3% in the last year, Tian Lun Gas Holdings shareholders lost 30% (even including dividends). Even the share prices of good stocks drop sometimes, but we want to see improvements in the fundamental metrics of a business, before getting too interested. Regrettably, last year's performance caps off a bad run, with the shareholders facing a total loss of 9% per year over five years. Generally speaking long term share price weakness can be a bad sign, though contrarian investors might want to research the stock in hope of a turnaround. While it is well worth considering the different impacts that market conditions can have on the share price, there are other factors that are even more important. Case in point: We've spotted 2 warning signs for Tian Lun Gas Holdings you should be aware of, and 1 of them can't be ignored.
If you like to buy stocks alongside management, then you might just love this free list of companies. (Hint: most of them are flying under the radar).
Please note, the market returns quoted in this article reflect the market weighted average returns of stocks that currently trade on Hong Kong exchanges.
Valuation is complex, but we're here to simplify it.
Discover if Tian Lun Gas Holdings might be undervalued or overvalued with our detailed analysis, featuring fair value estimates, potential risks, dividends, insider trades, and its financial condition.
Access Free AnalysisHave feedback on this article? Concerned about the content? Get in touch with us directly. Alternatively, email editorial-team (at) simplywallst.com.
This article by Simply Wall St is general in nature. We provide commentary based on historical data and analyst forecasts only using an unbiased methodology and our articles are not intended to be financial advice. It does not constitute a recommendation to buy or sell any stock, and does not take account of your objectives, or your financial situation. We aim to bring you long-term focused analysis driven by fundamental data. Note that our analysis may not factor in the latest price-sensitive company announcements or qualitative material. Simply Wall St has no position in any stocks mentioned.
Have feedback on this article? Concerned about the content? Get in touch with us directly. Alternatively, email editorial-team@simplywallst.com
About SEHK:1600
Tian Lun Gas Holdings
Engages in the transportation, distribution, and sale of natural gas and compressed natural gas through its gas pipeline connections in the People’ Republic of China.
Fair value with mediocre balance sheet.

