- Hong Kong
- /
- Renewable Energy
- /
- SEHK:1071
Huadian Power International Corporation Limited's (HKG:1071) Intrinsic Value Is Potentially 75% Above Its Share Price

Key Insights
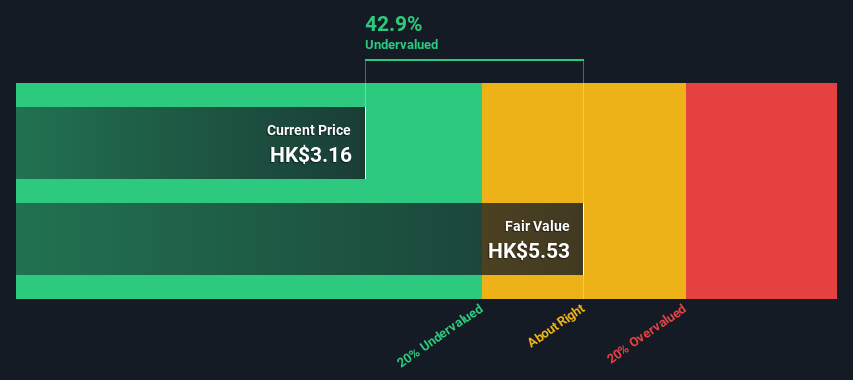
- Huadian Power International's estimated fair value is HK$5.53 based on 2 Stage Free Cash Flow to Equity
- Current share price of HK$3.16 suggests Huadian Power International is potentially 43% undervalued
- Analyst price target for 1071 is CN¥3.97 which is 28% below our fair value estimate
In this article we are going to estimate the intrinsic value of Huadian Power International Corporation Limited (HKG:1071) by projecting its future cash flows and then discounting them to today's value. One way to achieve this is by employing the Discounted Cash Flow (DCF) model. Models like these may appear beyond the comprehension of a lay person, but they're fairly easy to follow.
We generally believe that a company's value is the present value of all of the cash it will generate in the future. However, a DCF is just one valuation metric among many, and it is not without flaws. Anyone interested in learning a bit more about intrinsic value should have a read of the Simply Wall St analysis model.
Check out our latest analysis for Huadian Power International
The Calculation
We are going to use a two-stage DCF model, which, as the name states, takes into account two stages of growth. The first stage is generally a higher growth period which levels off heading towards the terminal value, captured in the second 'steady growth' period. To start off with, we need to estimate the next ten years of cash flows. Where possible we use analyst estimates, but when these aren't available we extrapolate the previous free cash flow (FCF) from the last estimate or reported value. We assume companies with shrinking free cash flow will slow their rate of shrinkage, and that companies with growing free cash flow will see their growth rate slow, over this period. We do this to reflect that growth tends to slow more in the early years than it does in later years.
A DCF is all about the idea that a dollar in the future is less valuable than a dollar today, so we need to discount the sum of these future cash flows to arrive at a present value estimate:
10-year free cash flow (FCF) estimate
| 2024 | 2025 | 2026 | 2027 | 2028 | 2029 | 2030 | 2031 | 2032 | 2033 | |
| Levered FCF (CN¥, Millions) | CN¥4.19b | CN¥3.94b | CN¥3.81b | CN¥3.73b | CN¥3.71b | CN¥3.71b | CN¥3.73b | CN¥3.77b | CN¥3.82b | CN¥3.87b |
| Growth Rate Estimate Source | Analyst x1 | Analyst x1 | Est @ -3.44% | Est @ -1.85% | Est @ -0.73% | Est @ 0.05% | Est @ 0.60% | Est @ 0.99% | Est @ 1.25% | Est @ 1.44% |
| Present Value (CN¥, Millions) Discounted @ 8.3% | CN¥3.9k | CN¥3.4k | CN¥3.0k | CN¥2.7k | CN¥2.5k | CN¥2.3k | CN¥2.1k | CN¥2.0k | CN¥1.9k | CN¥1.7k |
("Est" = FCF growth rate estimated by Simply Wall St)
Present Value of 10-year Cash Flow (PVCF) = CN¥25b
After calculating the present value of future cash flows in the initial 10-year period, we need to calculate the Terminal Value, which accounts for all future cash flows beyond the first stage. The Gordon Growth formula is used to calculate Terminal Value at a future annual growth rate equal to the 5-year average of the 10-year government bond yield of 1.9%. We discount the terminal cash flows to today's value at a cost of equity of 8.3%.
Terminal Value (TV)= FCF2033 × (1 + g) ÷ (r – g) = CN¥3.9b× (1 + 1.9%) ÷ (8.3%– 1.9%) = CN¥61b
Present Value of Terminal Value (PVTV)= TV / (1 + r)10= CN¥61b÷ ( 1 + 8.3%)10= CN¥28b
The total value, or equity value, is then the sum of the present value of the future cash flows, which in this case is CN¥53b. The last step is to then divide the equity value by the number of shares outstanding. Compared to the current share price of HK$3.2, the company appears quite good value at a 43% discount to where the stock price trades currently. Valuations are imprecise instruments though, rather like a telescope - move a few degrees and end up in a different galaxy. Do keep this in mind.
The Assumptions
Now the most important inputs to a discounted cash flow are the discount rate, and of course, the actual cash flows. Part of investing is coming up with your own evaluation of a company's future performance, so try the calculation yourself and check your own assumptions. The DCF also does not consider the possible cyclicality of an industry, or a company's future capital requirements, so it does not give a full picture of a company's potential performance. Given that we are looking at Huadian Power International as potential shareholders, the cost of equity is used as the discount rate, rather than the cost of capital (or weighted average cost of capital, WACC) which accounts for debt. In this calculation we've used 8.3%, which is based on a levered beta of 1.062. Beta is a measure of a stock's volatility, compared to the market as a whole. We get our beta from the industry average beta of globally comparable companies, with an imposed limit between 0.8 and 2.0, which is a reasonable range for a stable business.
SWOT Analysis for Huadian Power International
- Debt is well covered by earnings.
- Dividend is low compared to the top 25% of dividend payers in the Renewable Energy market.
- Shareholders have been diluted in the past year.
- Annual earnings are forecast to grow faster than the Hong Kong market.
- Trading below our estimate of fair value by more than 20%.
- Debt is not well covered by operating cash flow.
- Dividends are not covered by earnings and cashflows.
- Annual revenue is forecast to grow slower than the Hong Kong market.
Moving On:
Valuation is only one side of the coin in terms of building your investment thesis, and it ideally won't be the sole piece of analysis you scrutinize for a company. It's not possible to obtain a foolproof valuation with a DCF model. Instead the best use for a DCF model is to test certain assumptions and theories to see if they would lead to the company being undervalued or overvalued. For example, changes in the company's cost of equity or the risk free rate can significantly impact the valuation. Can we work out why the company is trading at a discount to intrinsic value? For Huadian Power International, there are three essential elements you should further research:
- Risks: We feel that you should assess the 3 warning signs for Huadian Power International (2 shouldn't be ignored!) we've flagged before making an investment in the company.
- Future Earnings: How does 1071's growth rate compare to its peers and the wider market? Dig deeper into the analyst consensus number for the upcoming years by interacting with our free analyst growth expectation chart.
- Other High Quality Alternatives: Do you like a good all-rounder? Explore our interactive list of high quality stocks to get an idea of what else is out there you may be missing!
PS. Simply Wall St updates its DCF calculation for every Hong Kong stock every day, so if you want to find the intrinsic value of any other stock just search here.
Valuation is complex, but we're here to simplify it.
Discover if Huadian Power International might be undervalued or overvalued with our detailed analysis, featuring fair value estimates, potential risks, dividends, insider trades, and its financial condition.
Access Free AnalysisHave feedback on this article? Concerned about the content? Get in touch with us directly. Alternatively, email editorial-team (at) simplywallst.com.
This article by Simply Wall St is general in nature. We provide commentary based on historical data and analyst forecasts only using an unbiased methodology and our articles are not intended to be financial advice. It does not constitute a recommendation to buy or sell any stock, and does not take account of your objectives, or your financial situation. We aim to bring you long-term focused analysis driven by fundamental data. Note that our analysis may not factor in the latest price-sensitive company announcements or qualitative material. Simply Wall St has no position in any stocks mentioned.
About SEHK:1071
Huadian Power International
Engages in the generation and sale of electricity, heat, and coal to power grid companies in the People’s Republic of China.
Very undervalued with proven track record.

