
Advertisement
Returns On Capital Signal Difficult Times Ahead For Tianjin Binhai Teda Logistics (Group) (HKG:8348)
What financial metrics can indicate to us that a company is maturing or even in decline? Typically, we'll see the trend of both return on capital employed (ROCE) declining and this usually coincides with a decreasing amount of capital employed. This combination can tell you that not only is the company investing less, it's earning less on what it does invest. Having said that, after a brief look, Tianjin Binhai Teda Logistics (Group) (HKG:8348) we aren't filled with optimism, but let's investigate further.
Understanding Return On Capital Employed (ROCE)
For those that aren't sure what ROCE is, it measures the amount of pre-tax profits a company can generate from the capital employed in its business. To calculate this metric for Tianjin Binhai Teda Logistics (Group), this is the formula:
Return on Capital Employed = Earnings Before Interest and Tax (EBIT) ÷ (Total Assets - Current Liabilities)
0.035 = CN¥39m ÷ (CN¥2.5b - CN¥1.4b) (Based on the trailing twelve months to June 2023).
Thus, Tianjin Binhai Teda Logistics (Group) has an ROCE of 3.5%. In absolute terms, that's a low return and it also under-performs the Logistics industry average of 5.4%.
View our latest analysis for Tianjin Binhai Teda Logistics (Group)
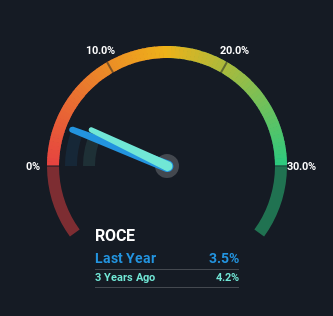
Historical performance is a great place to start when researching a stock so above you can see the gauge for Tianjin Binhai Teda Logistics (Group)'s ROCE against it's prior returns. If you're interested in investigating Tianjin Binhai Teda Logistics (Group)'s past further, check out this free graph of past earnings, revenue and cash flow.
So How Is Tianjin Binhai Teda Logistics (Group)'s ROCE Trending?
In terms of Tianjin Binhai Teda Logistics (Group)'s historical ROCE movements, the trend doesn't inspire confidence. About five years ago, returns on capital were 7.9%, however they're now substantially lower than that as we saw above. On top of that, it's worth noting that the amount of capital employed within the business has remained relatively steady. Since returns are falling and the business has the same amount of assets employed, this can suggest it's a mature business that hasn't had much growth in the last five years. If these trends continue, we wouldn't expect Tianjin Binhai Teda Logistics (Group) to turn into a multi-bagger.
On a separate but related note, it's important to know that Tianjin Binhai Teda Logistics (Group) has a current liabilities to total assets ratio of 56%, which we'd consider pretty high. This effectively means that suppliers (or short-term creditors) are funding a large portion of the business, so just be aware that this can introduce some elements of risk. Ideally we'd like to see this reduce as that would mean fewer obligations bearing risks.
In Conclusion...
All in all, the lower returns from the same amount of capital employed aren't exactly signs of a compounding machine. It should come as no surprise then that the stock has fallen 29% over the last five years, so it looks like investors are recognizing these changes. With underlying trends that aren't great in these areas, we'd consider looking elsewhere.
If you want to know some of the risks facing Tianjin Binhai Teda Logistics (Group) we've found 6 warning signs (1 is a bit concerning!) that you should be aware of before investing here.
For those who like to invest in solid companies, check out this free list of companies with solid balance sheets and high returns on equity.
Valuation is complex, but we're here to simplify it.
Discover if Tianjin Binhai Teda Logistics (Group) might be undervalued or overvalued with our detailed analysis, featuring fair value estimates, potential risks, dividends, insider trades, and its financial condition.
Access Free AnalysisHave feedback on this article? Concerned about the content? Get in touch with us directly. Alternatively, email editorial-team (at) simplywallst.com.
This article by Simply Wall St is general in nature. We provide commentary based on historical data and analyst forecasts only using an unbiased methodology and our articles are not intended to be financial advice. It does not constitute a recommendation to buy or sell any stock, and does not take account of your objectives, or your financial situation. We aim to bring you long-term focused analysis driven by fundamental data. Note that our analysis may not factor in the latest price-sensitive company announcements or qualitative material. Simply Wall St has no position in any stocks mentioned.
About SEHK:8348
Tianjin Binhai Teda Logistics (Group)
Provides logistics services primarily in the People’s Republic of China.
Excellent balance sheet with slight risk.
Market Insights

Advertisement
Community Narratives
MINISO's fair value is projected at 26.69 with an anticipated PE ratio shift of 20x
Fair Value US$24.03|11.0% undervalued
BE
Community Contributor
Procter & Gamble: A Dividend Giant Facing Slowing Growth
Fair Value US$119.81|23.3% overvalued
AN
Community Contributor
Eli Lilly's Future Growth Driven by Tirzepatide and Favorable Market Conditions
Fair Value US$1.19k|13.8% undervalued
EA
Community Contributor