
Advertisement
- Hong Kong
- /
- Infrastructure
- /
- SEHK:737
Shenzhen Investment Holdings Bay Area Development (HKG:737) Has A Somewhat Strained Balance Sheet
The external fund manager backed by Berkshire Hathaway's Charlie Munger, Li Lu, makes no bones about it when he says 'The biggest investment risk is not the volatility of prices, but whether you will suffer a permanent loss of capital.' When we think about how risky a company is, we always like to look at its use of debt, since debt overload can lead to ruin. As with many other companies Shenzhen Investment Holdings Bay Area Development Company Limited (HKG:737) makes use of debt. But the real question is whether this debt is making the company risky.
What Risk Does Debt Bring?
Debt and other liabilities become risky for a business when it cannot easily fulfill those obligations, either with free cash flow or by raising capital at an attractive price. If things get really bad, the lenders can take control of the business. While that is not too common, we often do see indebted companies permanently diluting shareholders because lenders force them to raise capital at a distressed price. Having said that, the most common situation is where a company manages its debt reasonably well - and to its own advantage. The first thing to do when considering how much debt a business uses is to look at its cash and debt together.
See our latest analysis for Shenzhen Investment Holdings Bay Area Development
What Is Shenzhen Investment Holdings Bay Area Development's Debt?
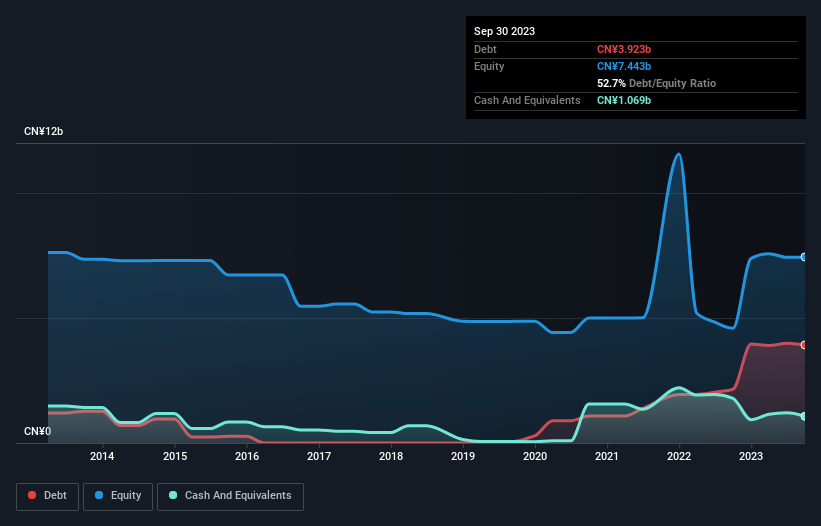
As you can see below, at the end of September 2023, Shenzhen Investment Holdings Bay Area Development had CN¥3.92b of debt, up from CN¥2.15b a year ago. Click the image for more detail. However, because it has a cash reserve of CN¥1.07b, its net debt is less, at about CN¥2.85b.
How Healthy Is Shenzhen Investment Holdings Bay Area Development's Balance Sheet?
According to the last reported balance sheet, Shenzhen Investment Holdings Bay Area Development had liabilities of CN¥2.33b due within 12 months, and liabilities of CN¥2.44b due beyond 12 months. Offsetting this, it had CN¥1.07b in cash and CN¥111.2m in receivables that were due within 12 months. So its liabilities outweigh the sum of its cash and (near-term) receivables by CN¥3.59b.
This deficit is considerable relative to its market capitalization of CN¥4.06b, so it does suggest shareholders should keep an eye on Shenzhen Investment Holdings Bay Area Development's use of debt. This suggests shareholders would be heavily diluted if the company needed to shore up its balance sheet in a hurry.
We measure a company's debt load relative to its earnings power by looking at its net debt divided by its earnings before interest, tax, depreciation, and amortization (EBITDA) and by calculating how easily its earnings before interest and tax (EBIT) cover its interest expense (interest cover). The advantage of this approach is that we take into account both the absolute quantum of debt (with net debt to EBITDA) and the actual interest expenses associated with that debt (with its interest cover ratio).
Shenzhen Investment Holdings Bay Area Development shareholders face the double whammy of a high net debt to EBITDA ratio (5.9), and fairly weak interest coverage, since EBIT is just 1.6 times the interest expense. This means we'd consider it to have a heavy debt load. One redeeming factor for Shenzhen Investment Holdings Bay Area Development is that it turned last year's EBIT loss into a gain of CN¥174m, over the last twelve months. There's no doubt that we learn most about debt from the balance sheet. But ultimately the future profitability of the business will decide if Shenzhen Investment Holdings Bay Area Development can strengthen its balance sheet over time. So if you want to see what the professionals think, you might find this free report on analyst profit forecasts to be interesting.
Finally, a company can only pay off debt with cold hard cash, not accounting profits. So it is important to check how much of its earnings before interest and tax (EBIT) converts to actual free cash flow. Happily for any shareholders, Shenzhen Investment Holdings Bay Area Development actually produced more free cash flow than EBIT over the last year. There's nothing better than incoming cash when it comes to staying in your lenders' good graces.
Our View
Neither Shenzhen Investment Holdings Bay Area Development's ability handle its debt, based on its EBITDA, nor its interest cover gave us confidence in its ability to take on more debt. But the good news is it seems to be able to convert EBIT to free cash flow with ease. It's also worth noting that Shenzhen Investment Holdings Bay Area Development is in the Infrastructure industry, which is often considered to be quite defensive. Taking the abovementioned factors together we do think Shenzhen Investment Holdings Bay Area Development's debt poses some risks to the business. So while that leverage does boost returns on equity, we wouldn't really want to see it increase from here. When analysing debt levels, the balance sheet is the obvious place to start. But ultimately, every company can contain risks that exist outside of the balance sheet. Case in point: We've spotted 2 warning signs for Shenzhen Investment Holdings Bay Area Development you should be aware of, and 1 of them shouldn't be ignored.
Of course, if you're the type of investor who prefers buying stocks without the burden of debt, then don't hesitate to discover our exclusive list of net cash growth stocks, today.
New: Manage All Your Stock Portfolios in One Place
We've created the ultimate portfolio companion for stock investors, and it's free.
• Connect an unlimited number of Portfolios and see your total in one currency
• Be alerted to new Warning Signs or Risks via email or mobile
• Track the Fair Value of your stocks
Have feedback on this article? Concerned about the content? Get in touch with us directly. Alternatively, email editorial-team (at) simplywallst.com.
This article by Simply Wall St is general in nature. We provide commentary based on historical data and analyst forecasts only using an unbiased methodology and our articles are not intended to be financial advice. It does not constitute a recommendation to buy or sell any stock, and does not take account of your objectives, or your financial situation. We aim to bring you long-term focused analysis driven by fundamental data. Note that our analysis may not factor in the latest price-sensitive company announcements or qualitative material. Simply Wall St has no position in any stocks mentioned.
About SEHK:737
Shenzhen Investment Holdings Bay Area Development
An investment holding company, initiates, promotes, develops, and operates toll expressways and bridges in the People’s Republic of China.
Second-rate dividend payer with low risk.
Market Insights

Advertisement
Community Narratives
MINISO's fair value is projected at 26.69 with an anticipated PE ratio shift of 20x
Fair Value US$24.03|11.0% undervalued
BE
Community Contributor
Procter & Gamble: A Dividend Giant Facing Slowing Growth
Fair Value US$119.81|23.3% overvalued
AN
Community Contributor
Eli Lilly's Future Growth Driven by Tirzepatide and Favorable Market Conditions
Fair Value US$1.19k|13.8% undervalued
EA
Community Contributor