
Advertisement
- Hong Kong
- /
- Infrastructure
- /
- SEHK:548
Is Shenzhen Expressway Corporation Limited (HKG:548) Trading At A 46% Discount?
Key Insights
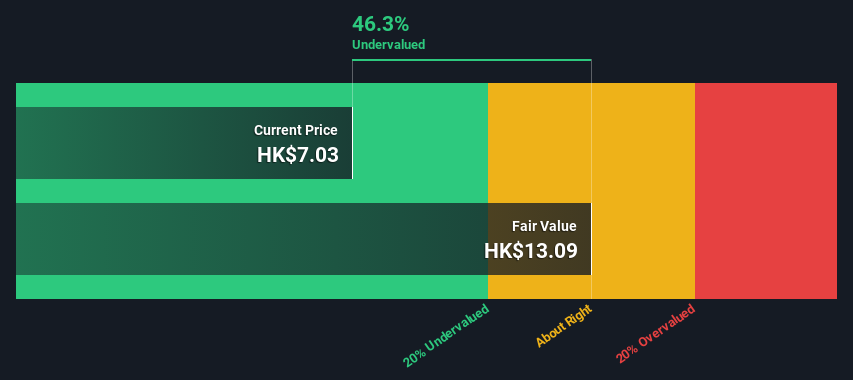
- Using the 2 Stage Free Cash Flow to Equity, Shenzhen Expressway fair value estimate is HK$13.09
- Current share price of HK$7.03 suggests Shenzhen Expressway is potentially 46% undervalued
- Our fair value estimate is 47% higher than Shenzhen Expressway's analyst price target of CN¥8.88
In this article we are going to estimate the intrinsic value of Shenzhen Expressway Corporation Limited (HKG:548) by estimating the company's future cash flows and discounting them to their present value. The Discounted Cash Flow (DCF) model is the tool we will apply to do this. There's really not all that much to it, even though it might appear quite complex.
Companies can be valued in a lot of ways, so we would point out that a DCF is not perfect for every situation. If you want to learn more about discounted cash flow, the rationale behind this calculation can be read in detail in the Simply Wall St analysis model.
See our latest analysis for Shenzhen Expressway
Crunching The Numbers
We are going to use a two-stage DCF model, which, as the name states, takes into account two stages of growth. The first stage is generally a higher growth period which levels off heading towards the terminal value, captured in the second 'steady growth' period. To start off with, we need to estimate the next ten years of cash flows. Seeing as no analyst estimates of free cash flow are available to us, we have extrapolate the previous free cash flow (FCF) from the company's last reported value. We assume companies with shrinking free cash flow will slow their rate of shrinkage, and that companies with growing free cash flow will see their growth rate slow, over this period. We do this to reflect that growth tends to slow more in the early years than it does in later years.
A DCF is all about the idea that a dollar in the future is less valuable than a dollar today, so we discount the value of these future cash flows to their estimated value in today's dollars:
10-year free cash flow (FCF) forecast
| 2025 | 2026 | 2027 | 2028 | 2029 | 2030 | 2031 | 2032 | 2033 | 2034 | |
| Levered FCF (CN¥, Millions) | CN¥2.13b | CN¥2.35b | CN¥2.55b | CN¥2.71b | CN¥2.85b | CN¥2.97b | CN¥3.08b | CN¥3.18b | CN¥3.28b | CN¥3.37b |
| Growth Rate Estimate Source | Est @ 14.36% | Est @ 10.73% | Est @ 8.18% | Est @ 6.40% | Est @ 5.16% | Est @ 4.29% | Est @ 3.67% | Est @ 3.25% | Est @ 2.95% | Est @ 2.74% |
| Present Value (CN¥, Millions) Discounted @ 12% | CN¥1.9k | CN¥1.9k | CN¥1.8k | CN¥1.7k | CN¥1.6k | CN¥1.5k | CN¥1.4k | CN¥1.3k | CN¥1.2k | CN¥1.1k |
("Est" = FCF growth rate estimated by Simply Wall St)
Present Value of 10-year Cash Flow (PVCF) = CN¥15b
After calculating the present value of future cash flows in the initial 10-year period, we need to calculate the Terminal Value, which accounts for all future cash flows beyond the first stage. For a number of reasons a very conservative growth rate is used that cannot exceed that of a country's GDP growth. In this case we have used the 5-year average of the 10-year government bond yield (2.3%) to estimate future growth. In the same way as with the 10-year 'growth' period, we discount future cash flows to today's value, using a cost of equity of 12%.
Terminal Value (TV)= FCF2034 × (1 + g) ÷ (r – g) = CN¥3.4b× (1 + 2.3%) ÷ (12%– 2.3%) = CN¥35b
Present Value of Terminal Value (PVTV)= TV / (1 + r)10= CN¥35b÷ ( 1 + 12%)10= CN¥11b
The total value, or equity value, is then the sum of the present value of the future cash flows, which in this case is CN¥26b. In the final step we divide the equity value by the number of shares outstanding. Compared to the current share price of HK$7.0, the company appears quite good value at a 46% discount to where the stock price trades currently. The assumptions in any calculation have a big impact on the valuation, so it is better to view this as a rough estimate, not precise down to the last cent.
The Assumptions
The calculation above is very dependent on two assumptions. The first is the discount rate and the other is the cash flows. If you don't agree with these result, have a go at the calculation yourself and play with the assumptions. The DCF also does not consider the possible cyclicality of an industry, or a company's future capital requirements, so it does not give a full picture of a company's potential performance. Given that we are looking at Shenzhen Expressway as potential shareholders, the cost of equity is used as the discount rate, rather than the cost of capital (or weighted average cost of capital, WACC) which accounts for debt. In this calculation we've used 12%, which is based on a levered beta of 2.000. Beta is a measure of a stock's volatility, compared to the market as a whole. We get our beta from the industry average beta of globally comparable companies, with an imposed limit between 0.8 and 2.0, which is a reasonable range for a stable business.
SWOT Analysis for Shenzhen Expressway
Strength
- Earnings growth over the past year exceeded its 5-year average.
- Debt is well covered by earnings.
- Dividends are covered by earnings and cash flows.
- Dividend is in the top 25% of dividend payers in the market.
Weakness
- Earnings growth over the past year underperformed the Infrastructure industry.
Opportunity
- Annual revenue is forecast to grow faster than the Hong Kong market.
- Good value based on P/E ratio and estimated fair value.
Threat
- Debt is not well covered by operating cash flow.
- Annual earnings are forecast to grow slower than the Hong Kong market.
Moving On:
Although the valuation of a company is important, it ideally won't be the sole piece of analysis you scrutinize for a company. DCF models are not the be-all and end-all of investment valuation. Preferably you'd apply different cases and assumptions and see how they would impact the company's valuation. If a company grows at a different rate, or if its cost of equity or risk free rate changes sharply, the output can look very different. What is the reason for the share price sitting below the intrinsic value? For Shenzhen Expressway, we've compiled three fundamental aspects you should look at:
- Risks: Consider for instance, the ever-present spectre of investment risk. We've identified 2 warning signs with Shenzhen Expressway (at least 1 which is concerning) , and understanding them should be part of your investment process.
- Future Earnings: How does 548's growth rate compare to its peers and the wider market? Dig deeper into the analyst consensus number for the upcoming years by interacting with our free analyst growth expectation chart.
- Other High Quality Alternatives: Do you like a good all-rounder? Explore our interactive list of high quality stocks to get an idea of what else is out there you may be missing!
PS. The Simply Wall St app conducts a discounted cash flow valuation for every stock on the SEHK every day. If you want to find the calculation for other stocks just search here.
New: Manage All Your Stock Portfolios in One Place
We've created the ultimate portfolio companion for stock investors, and it's free.
• Connect an unlimited number of Portfolios and see your total in one currency
• Be alerted to new Warning Signs or Risks via email or mobile
• Track the Fair Value of your stocks
Have feedback on this article? Concerned about the content? Get in touch with us directly. Alternatively, email editorial-team (at) simplywallst.com.
This article by Simply Wall St is general in nature. We provide commentary based on historical data and analyst forecasts only using an unbiased methodology and our articles are not intended to be financial advice. It does not constitute a recommendation to buy or sell any stock, and does not take account of your objectives, or your financial situation. We aim to bring you long-term focused analysis driven by fundamental data. Note that our analysis may not factor in the latest price-sensitive company announcements or qualitative material. Simply Wall St has no position in any stocks mentioned.
About SEHK:548
Shenzhen Expressway
Primarily invests in, constructs, operates, and manages toll highways and roads, as well as other urban and transportation infrastructure in the People’s Republic of China.
Slight risk second-rate dividend payer.
Market Insights

Advertisement
Community Narratives
Finding The True Value Of A Logistics Powerhouse
Fair Value US$95.21|8.6% undervalued
NV
Community Contributor
Paradigm Biopharmaceuticals Will Lead Osteoarthritis Treatment with Zilosul's FDA Success
Fair Value AU$5.50|92.1% undervalued
AM
Community Contributor
Barrick Mining (ABX:CA): A Gold Hedge against a U.S. Shutdown
Fair Value CA$60.00|25.6% undervalued
GM
Community Contributor