Stock Analysis
- Hong Kong
- /
- Infrastructure
- /
- SEHK:152
Shenzhen International Holdings (HKG:152) stock falls 3.4% in past week as five-year earnings and shareholder returns continue downward trend

Ideally, your overall portfolio should beat the market average. But every investor is virtually certain to have both over-performing and under-performing stocks. So we wouldn't blame long term Shenzhen International Holdings Limited (HKG:152) shareholders for doubting their decision to hold, with the stock down 59% over a half decade.
If the past week is anything to go by, investor sentiment for Shenzhen International Holdings isn't positive, so let's see if there's a mismatch between fundamentals and the share price.
See our latest analysis for Shenzhen International Holdings
To quote Buffett, 'Ships will sail around the world but the Flat Earth Society will flourish. There will continue to be wide discrepancies between price and value in the marketplace...' One flawed but reasonable way to assess how sentiment around a company has changed is to compare the earnings per share (EPS) with the share price.
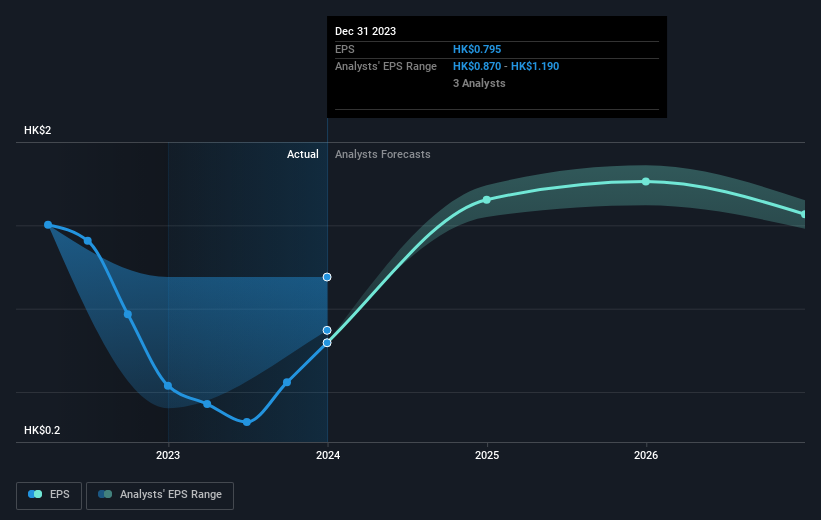
Looking back five years, both Shenzhen International Holdings' share price and EPS declined; the latter at a rate of 17% per year. This change in EPS is remarkably close to the 17% average annual decrease in the share price. This implies that the market has had a fairly steady view of the stock. So it's fair to say the share price has been responding to changes in EPS.
The company's earnings per share (over time) is depicted in the image below (click to see the exact numbers).
We consider it positive that insiders have made significant purchases in the last year. Even so, future earnings will be far more important to whether current shareholders make money. Before buying or selling a stock, we always recommend a close examination of historic growth trends, available here..
What About Dividends?
As well as measuring the share price return, investors should also consider the total shareholder return (TSR). The TSR incorporates the value of any spin-offs or discounted capital raisings, along with any dividends, based on the assumption that the dividends are reinvested. So for companies that pay a generous dividend, the TSR is often a lot higher than the share price return. In the case of Shenzhen International Holdings, it has a TSR of -43% for the last 5 years. That exceeds its share price return that we previously mentioned. This is largely a result of its dividend payments!
A Different Perspective
Investors in Shenzhen International Holdings had a tough year, with a total loss of 4.9% (including dividends), against a market gain of about 5.6%. However, keep in mind that even the best stocks will sometimes underperform the market over a twelve month period. Unfortunately, longer term shareholders are suffering worse, given the loss of 7% doled out over the last five years. We would want clear information suggesting the company will grow, before taking the view that the share price will stabilize. It's always interesting to track share price performance over the longer term. But to understand Shenzhen International Holdings better, we need to consider many other factors. For example, we've discovered 2 warning signs for Shenzhen International Holdings (1 is a bit concerning!) that you should be aware of before investing here.
Shenzhen International Holdings is not the only stock insiders are buying. So take a peek at this free list of small cap companies at attractive valuations which insiders have been buying.
Please note, the market returns quoted in this article reflect the market weighted average returns of stocks that currently trade on Hong Kong exchanges.
New: Manage All Your Stock Portfolios in One Place
We've created the ultimate portfolio companion for stock investors, and it's free.
• Connect an unlimited number of Portfolios and see your total in one currency
• Be alerted to new Warning Signs or Risks via email or mobile
• Track the Fair Value of your stocks
Have feedback on this article? Concerned about the content? Get in touch with us directly. Alternatively, email editorial-team (at) simplywallst.com.
This article by Simply Wall St is general in nature. We provide commentary based on historical data and analyst forecasts only using an unbiased methodology and our articles are not intended to be financial advice. It does not constitute a recommendation to buy or sell any stock, and does not take account of your objectives, or your financial situation. We aim to bring you long-term focused analysis driven by fundamental data. Note that our analysis may not factor in the latest price-sensitive company announcements or qualitative material. Simply Wall St has no position in any stocks mentioned.
Have feedback on this article? Concerned about the content? Get in touch with us directly. Alternatively, email editorial-team@simplywallst.com
About SEHK:152
Shenzhen International Holdings
An investment holding company, invests in, constructs, and operates logistics infrastructure facilities primarily in the People’s Republic of China.
Proven track record and fair value.
