Stock Analysis
- Hong Kong
- /
- Wireless Telecom
- /
- SEHK:941
Those who invested in China Mobile (HKG:941) three years ago are up 79%


By buying an index fund, investors can approximate the average market return. But if you buy good businesses at attractive prices, your portfolio returns could exceed the average market return. For example, the China Mobile Limited (HKG:941) share price is up 47% in the last three years, clearly besting the market decline of around 25% (not including dividends). However, more recent returns haven't been as impressive as that, with the stock returning just 22% in the last year, including dividends.
Now it's worth having a look at the company's fundamentals too, because that will help us determine if the long term shareholder return has matched the performance of the underlying business.
See our latest analysis for China Mobile
In his essay The Superinvestors of Graham-and-Doddsville Warren Buffett described how share prices do not always rationally reflect the value of a business. By comparing earnings per share (EPS) and share price changes over time, we can get a feel for how investor attitudes to a company have morphed over time.
China Mobile was able to grow its EPS at 5.7% per year over three years, sending the share price higher. This EPS growth is lower than the 14% average annual increase in the share price. This indicates that the market is feeling more optimistic on the stock, after the last few years of progress. That's not necessarily surprising considering the three-year track record of earnings growth.
The graphic below depicts how EPS has changed over time (unveil the exact values by clicking on the image).
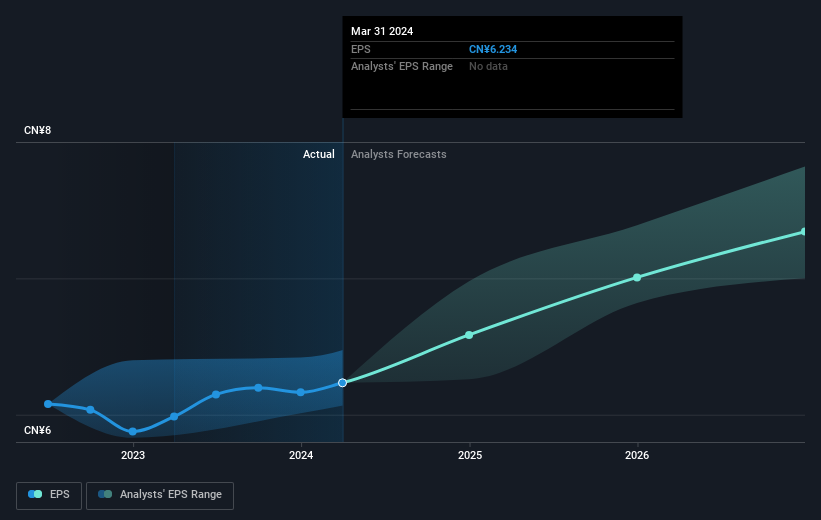
Dive deeper into China Mobile's key metrics by checking this interactive graph of China Mobile's earnings, revenue and cash flow.
What About Dividends?
As well as measuring the share price return, investors should also consider the total shareholder return (TSR). The TSR is a return calculation that accounts for the value of cash dividends (assuming that any dividend received was reinvested) and the calculated value of any discounted capital raisings and spin-offs. So for companies that pay a generous dividend, the TSR is often a lot higher than the share price return. We note that for China Mobile the TSR over the last 3 years was 79%, which is better than the share price return mentioned above. This is largely a result of its dividend payments!
A Different Perspective
It's good to see that China Mobile has rewarded shareholders with a total shareholder return of 22% in the last twelve months. Of course, that includes the dividend. Since the one-year TSR is better than the five-year TSR (the latter coming in at 7% per year), it would seem that the stock's performance has improved in recent times. Given the share price momentum remains strong, it might be worth taking a closer look at the stock, lest you miss an opportunity. Keeping this in mind, a solid next step might be to take a look at China Mobile's dividend track record. This free interactive graph is a great place to start.
If you would prefer to check out another company -- one with potentially superior financials -- then do not miss this free list of companies that have proven they can grow earnings.
Please note, the market returns quoted in this article reflect the market weighted average returns of stocks that currently trade on Hong Kong exchanges.
Valuation is complex, but we're helping make it simple.
Find out whether China Mobile is potentially over or undervalued by checking out our comprehensive analysis, which includes fair value estimates, risks and warnings, dividends, insider transactions and financial health.
View the Free AnalysisHave feedback on this article? Concerned about the content? Get in touch with us directly. Alternatively, email editorial-team (at) simplywallst.com.
This article by Simply Wall St is general in nature. We provide commentary based on historical data and analyst forecasts only using an unbiased methodology and our articles are not intended to be financial advice. It does not constitute a recommendation to buy or sell any stock, and does not take account of your objectives, or your financial situation. We aim to bring you long-term focused analysis driven by fundamental data. Note that our analysis may not factor in the latest price-sensitive company announcements or qualitative material. Simply Wall St has no position in any stocks mentioned.
About SEHK:941
China Mobile
Provides telecommunications and information related services in Mainland China and Hong Kong.
Undervalued with excellent balance sheet and pays a dividend.
