Calculating The Fair Value Of VSTECS Holdings Limited (HKG:856)

Today we'll do a simple run through of a valuation method used to estimate the attractiveness of VSTECS Holdings Limited (HKG:856) as an investment opportunity by taking the expected future cash flows and discounting them to their present value. The Discounted Cash Flow (DCF) model is the tool we will apply to do this. There's really not all that much to it, even though it might appear quite complex.
Remember though, that there are many ways to estimate a company's value, and a DCF is just one method. For those who are keen learners of equity analysis, the Simply Wall St analysis model here may be something of interest to you.
See our latest analysis for VSTECS Holdings
What's the estimated valuation?
We're using the 2-stage growth model, which simply means we take in account two stages of company's growth. In the initial period the company may have a higher growth rate and the second stage is usually assumed to have a stable growth rate. To start off with, we need to estimate the next ten years of cash flows. Where possible we use analyst estimates, but when these aren't available we extrapolate the previous free cash flow (FCF) from the last estimate or reported value. We assume companies with shrinking free cash flow will slow their rate of shrinkage, and that companies with growing free cash flow will see their growth rate slow, over this period. We do this to reflect that growth tends to slow more in the early years than it does in later years.
Generally we assume that a dollar today is more valuable than a dollar in the future, so we need to discount the sum of these future cash flows to arrive at a present value estimate:
10-year free cash flow (FCF) estimate
| 2021 | 2022 | 2023 | 2024 | 2025 | 2026 | 2027 | 2028 | 2029 | 2030 | |
| Levered FCF (HK$, Millions) | HK$1.17b | HK$1.11b | HK$1.22b | HK$1.25b | HK$1.27b | HK$1.29b | HK$1.31b | HK$1.34b | HK$1.36b | HK$1.38b |
| Growth Rate Estimate Source | Analyst x1 | Analyst x1 | Analyst x1 | Est @ 1.95% | Est @ 1.82% | Est @ 1.73% | Est @ 1.66% | Est @ 1.62% | Est @ 1.58% | Est @ 1.56% |
| Present Value (HK$, Millions) Discounted @ 11% | HK$1.1k | HK$902 | HK$896 | HK$823 | HK$755 | HK$692 | HK$634 | HK$581 | HK$532 | HK$487 |
("Est" = FCF growth rate estimated by Simply Wall St)
Present Value of 10-year Cash Flow (PVCF) = HK$7.4b
We now need to calculate the Terminal Value, which accounts for all the future cash flows after this ten year period. The Gordon Growth formula is used to calculate Terminal Value at a future annual growth rate equal to the 5-year average of the 10-year government bond yield of 1.5%. We discount the terminal cash flows to today's value at a cost of equity of 11%.
Terminal Value (TV)= FCF2030 × (1 + g) ÷ (r – g) = HK$1.4b× (1 + 1.5%) ÷ (11%– 1.5%) = HK$15b
Present Value of Terminal Value (PVTV)= TV / (1 + r)10= HK$15b÷ ( 1 + 11%)10= HK$5.2b
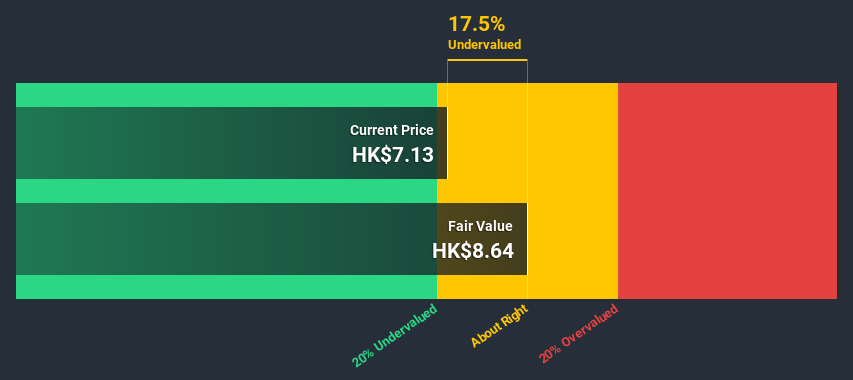
The total value, or equity value, is then the sum of the present value of the future cash flows, which in this case is HK$13b. In the final step we divide the equity value by the number of shares outstanding. Compared to the current share price of HK$7.1, the company appears about fair value at a 18% discount to where the stock price trades currently. The assumptions in any calculation have a big impact on the valuation, so it is better to view this as a rough estimate, not precise down to the last cent.
Important assumptions
We would point out that the most important inputs to a discounted cash flow are the discount rate and of course the actual cash flows. You don't have to agree with these inputs, I recommend redoing the calculations yourself and playing with them. The DCF also does not consider the possible cyclicality of an industry, or a company's future capital requirements, so it does not give a full picture of a company's potential performance. Given that we are looking at VSTECS Holdings as potential shareholders, the cost of equity is used as the discount rate, rather than the cost of capital (or weighted average cost of capital, WACC) which accounts for debt. In this calculation we've used 11%, which is based on a levered beta of 1.546. Beta is a measure of a stock's volatility, compared to the market as a whole. We get our beta from the industry average beta of globally comparable companies, with an imposed limit between 0.8 and 2.0, which is a reasonable range for a stable business.
Next Steps:
Whilst important, the DCF calculation is only one of many factors that you need to assess for a company. The DCF model is not a perfect stock valuation tool. Instead the best use for a DCF model is to test certain assumptions and theories to see if they would lead to the company being undervalued or overvalued. For example, changes in the company's cost of equity or the risk free rate can significantly impact the valuation. For VSTECS Holdings, we've put together three additional items you should further examine:
- Risks: You should be aware of the 2 warning signs for VSTECS Holdings we've uncovered before considering an investment in the company.
- Future Earnings: How does 856's growth rate compare to its peers and the wider market? Dig deeper into the analyst consensus number for the upcoming years by interacting with our free analyst growth expectation chart.
- Other High Quality Alternatives: Do you like a good all-rounder? Explore our interactive list of high quality stocks to get an idea of what else is out there you may be missing!
PS. Simply Wall St updates its DCF calculation for every Hong Kong stock every day, so if you want to find the intrinsic value of any other stock just search here.
If you’re looking to trade VSTECS Holdings, open an account with the lowest-cost* platform trusted by professionals, Interactive Brokers. Their clients from over 200 countries and territories trade stocks, options, futures, forex, bonds and funds worldwide from a single integrated account. Promoted
Mobile Infrastructure for Defense and Disaster
The next wave in robotics isn't humanoid. Its fully autonomous towers delivering 5G, ISR, and radar in under 30 minutes, anywhere.
Get the investor briefing before the next round of contracts
Sponsored On Behalf of CiTechNew: Manage All Your Stock Portfolios in One Place
We've created the ultimate portfolio companion for stock investors, and it's free.
• Connect an unlimited number of Portfolios and see your total in one currency
• Be alerted to new Warning Signs or Risks via email or mobile
• Track the Fair Value of your stocks
This article by Simply Wall St is general in nature. It does not constitute a recommendation to buy or sell any stock, and does not take account of your objectives, or your financial situation. We aim to bring you long-term focused analysis driven by fundamental data. Note that our analysis may not factor in the latest price-sensitive company announcements or qualitative material. Simply Wall St has no position in any stocks mentioned.
*Interactive Brokers Rated Lowest Cost Broker by StockBrokers.com Annual Online Review 2020
Have feedback on this article? Concerned about the content? Get in touch with us directly. Alternatively, email editorial-team (at) simplywallst.com.
About SEHK:856
VSTECS Holdings
An investment holding company, develops information technology IT product channel and provides technical solution integration services in North Asia and Southeast Asia.
Excellent balance sheet, good value and pays a dividend.
Similar Companies
Market Insights

Weekly Picks

Early mover in a fast growing industry. Likely to experience share price volatility as they scale


A case for CA$31.80 (undiluted), aka 8,616% upside from CA$0.37 (an 86 bagger!).


Moderation and Stabilisation: HOLD: Fair Price based on a 4-year Cycle is $12.08
Recently Updated Narratives

Airbnb Stock: Platform Growth in a World of Saturation and Scrutiny

Adobe Stock: AI-Fueled ARR Growth Pushes Guidance Higher, But Cost Pressures Loom

Thomson Reuters Stock: When Legal Intelligence Becomes Mission-Critical Infrastructure
Popular Narratives


Crazy Undervalued 42 Baggers Silver Play (Active & Running Mine)


NVDA: Expanding AI Demand Will Drive Major Data Center Investments Through 2026

The AI Infrastructure Giant Grows Into Its Valuation
Trending Discussion


