
Advertisement
- Hong Kong
- /
- Tech Hardware
- /
- SEHK:8111
Would China Technology Industry Group (HKG:8111) Be Better Off With Less Debt?
Howard Marks put it nicely when he said that, rather than worrying about share price volatility, 'The possibility of permanent loss is the risk I worry about... and every practical investor I know worries about.' So it seems the smart money knows that debt - which is usually involved in bankruptcies - is a very important factor, when you assess how risky a company is. We note that China Technology Industry Group Limited (HKG:8111) does have debt on its balance sheet. But is this debt a concern to shareholders?
When Is Debt A Problem?
Debt is a tool to help businesses grow, but if a business is incapable of paying off its lenders, then it exists at their mercy. Ultimately, if the company can't fulfill its legal obligations to repay debt, shareholders could walk away with nothing. While that is not too common, we often do see indebted companies permanently diluting shareholders because lenders force them to raise capital at a distressed price. Of course, the upside of debt is that it often represents cheap capital, especially when it replaces dilution in a company with the ability to reinvest at high rates of return. The first thing to do when considering how much debt a business uses is to look at its cash and debt together.
See our latest analysis for China Technology Industry Group
What Is China Technology Industry Group's Net Debt?
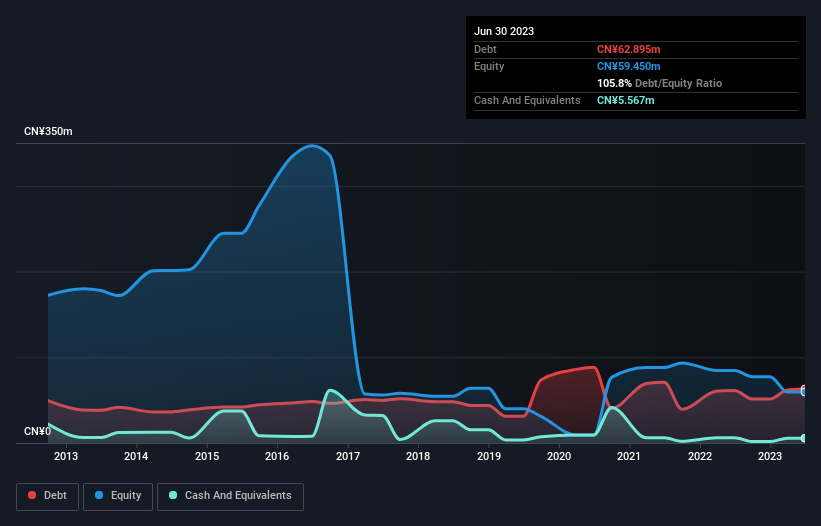
The chart below, which you can click on for greater detail, shows that China Technology Industry Group had CN¥62.9m in debt in March 2023; about the same as the year before. On the flip side, it has CN¥5.57m in cash leading to net debt of about CN¥57.3m.
How Strong Is China Technology Industry Group's Balance Sheet?
Zooming in on the latest balance sheet data, we can see that China Technology Industry Group had liabilities of CN¥82.2m due within 12 months and liabilities of CN¥426.0k due beyond that. Offsetting these obligations, it had cash of CN¥5.57m as well as receivables valued at CN¥111.3m due within 12 months. So it actually has CN¥34.3m more liquid assets than total liabilities.
This excess liquidity is a great indication that China Technology Industry Group's balance sheet is almost as strong as Fort Knox. With this in mind one could posit that its balance sheet means the company is able to handle some adversity. The balance sheet is clearly the area to focus on when you are analysing debt. But it is China Technology Industry Group's earnings that will influence how the balance sheet holds up in the future. So if you're keen to discover more about its earnings, it might be worth checking out this graph of its long term earnings trend.
In the last year China Technology Industry Group had a loss before interest and tax, and actually shrunk its revenue by 83%, to CN¥16m. That makes us nervous, to say the least.
Caveat Emptor
Not only did China Technology Industry Group's revenue slip over the last twelve months, but it also produced negative earnings before interest and tax (EBIT). Its EBIT loss was a whopping CN¥28m. Having said that, the balance sheet has plenty of liquid assets for now. That will give the company some time and space to grow and develop its business as need be. The company is risky because it will grow into the future to get to profitability and free cash flow. The balance sheet is clearly the area to focus on when you are analysing debt. However, not all investment risk resides within the balance sheet - far from it. To that end, you should learn about the 3 warning signs we've spotted with China Technology Industry Group (including 1 which is a bit concerning) .
When all is said and done, sometimes its easier to focus on companies that don't even need debt. Readers can access a list of growth stocks with zero net debt 100% free, right now.
New: AI Stock Screener & Alerts
Our new AI Stock Screener scans the market every day to uncover opportunities.
• Dividend Powerhouses (3%+ Yield)
• Undervalued Small Caps with Insider Buying
• High growth Tech and AI Companies
Or build your own from over 50 metrics.
Have feedback on this article? Concerned about the content? Get in touch with us directly. Alternatively, email editorial-team (at) simplywallst.com.
This article by Simply Wall St is general in nature. We provide commentary based on historical data and analyst forecasts only using an unbiased methodology and our articles are not intended to be financial advice. It does not constitute a recommendation to buy or sell any stock, and does not take account of your objectives, or your financial situation. We aim to bring you long-term focused analysis driven by fundamental data. Note that our analysis may not factor in the latest price-sensitive company announcements or qualitative material. Simply Wall St has no position in any stocks mentioned.
About SEHK:8111
China Technology Industry Group
An investment holding company, engages in the sales of the renewable energy products business and new energy power system integration and electricity business in Hong Kong.
Adequate balance sheet with slight risk.
Market Insights

Advertisement
Community Narratives
MicroVision will explode future revenue by 380.37% with a vision towards success
Fair Value US$60.00|98.5% undervalued
TH
Community Contributor
The Indispensable Artery for a New North American Economy
Fair Value CA$132.87|2.3% undervalued
TI
Community Contributor